Consider the following vectors: 1. Aedes mosquito 2. Flea 3. Ticks 4. Itchmite Transovarian transmission is demonstrated in
Consider the following diseases: 1. Rift valley fever 2. Yellow Fever 3. Chikungunya fever 4. West Nile fever Which of the above diseases are transmitted by Aedes mosquito?
The time period from entry of an infective agent into a host until the host develops the capacity for maximal infectivity is called:
A village 'X' has a population of 5000 with a birth rate of 25 per thousand. In any given month, how many pregnancies should be registered with the ANM of this village?
Association between hardness of drinking water and death rate from cardiovascular diseases is:
Which one of the following epidemiologic methods can be used to identify risk factors and estimate the degree of risk?
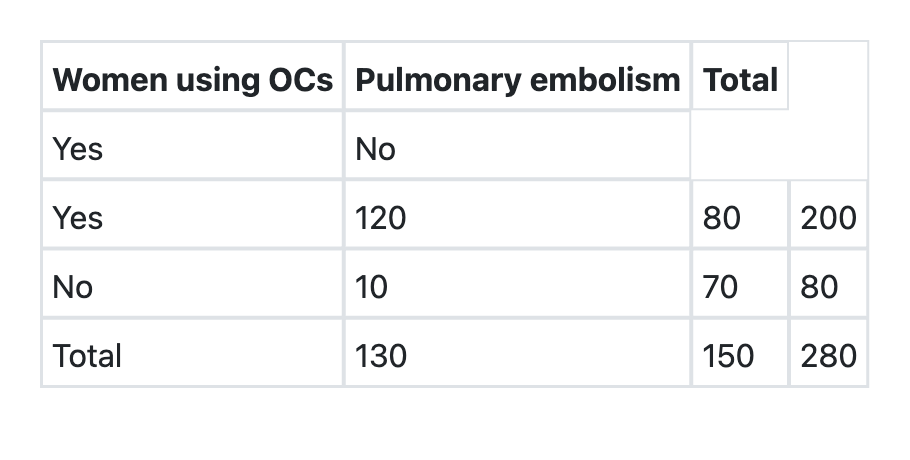
What is the relative risk of developing pulmonary embolism in users of oral contraceptives as per the information given below?

In a family of six (2 parents and 4 children), the youngest child catches measles infection. The parents are immune to the infection. On 3rd and 5th day of the infection of the first child, the two other children also suffer from measles. The secondary attack rate (SAR) of measles is:
Standardized Mortality ratio is best explained by which one of the following statements?
In a case-control study, 300 women aged 20-45 years suffering from breast cancer were compared with age-matched 300 women without breast cancer. It was observed that 120 women among cases and 60 women among controls were obese. The odds ratio of developing breast cancer among obese women is:
Explanation: ***1 and 3*** - **Aedes mosquito** (*Aedes aegypti*, *Aedes albopictus*) demonstrates well-established transovarian transmission for multiple arboviruses including **dengue**, **Zika**, **chikungunya**, and **yellow fever**. This mechanism allows the virus to persist in mosquito populations even without vertebrate hosts. - **Ticks** (e.g., *Ixodes*, *Dermacentor*, *Amblyomma* species) are classic examples of transovarian transmission, transmitting pathogens like **Rickettsia** (Rocky Mountain spotted fever, tick typhus), **Babesia**, **Crimean-Congo hemorrhagic fever virus**, and **Kyasanur Forest disease virus**. This is a key epidemiological feature distinguishing tick-borne diseases. *2 and 4* - **Fleas** primarily transmit **plague** (*Yersinia pestis*) horizontally through infected flea bites or contaminated feces. While some rickettsiae (*R. typhi*, *R. felis*) can show limited transovarian transmission in fleas, this is not a prominent or classically emphasized feature compared to mosquitoes and ticks. - **Itchmite** (*Sarcoptes scabiei*) causes **scabies** by direct skin infestation and is not a vector for other pathogens. It does not demonstrate transovarian transmission of disease agents. *1 and 2* - While **Aedes mosquitoes** demonstrate prominent transovarian transmission, **fleas** do not typically exhibit this as a major transmission mode for their primary pathogens. *3 and 4* - **Ticks** exhibit transovarian transmission, but **itchmite** is a direct parasite, not a disease vector with transovarian transmission capability.
Explanation: ***1, 2 and 3*** - **Rift Valley fever**, **Yellow fever**, and **Chikungunya fever** are all primarily transmitted to humans through the bites of infected **Aedes mosquitoes**. - The **Aedes aegypti** and **Aedes albopictus** species are particularly significant vectors for these viral diseases. *1, 2 and 4* - This option incorrectly includes **West Nile fever** while omitting **Chikungunya fever**. - **West Nile fever** is primarily transmitted by **Culex mosquitoes**, not Aedes mosquitoes. *2, 3 and 4* - This option incorrectly includes **West Nile fever** as an Aedes mosquito-borne disease. - **Yellow fever** and **Chikungunya fever** are indeed transmitted by Aedes mosquitoes, but **West Nile fever** is not. *1, 3 and 4* - This option incorrectly includes **West Nile fever** in the list of Aedes-borne diseases. - While **Rift Valley fever** and **Chikungunya fever** are transmitted by Aedes mosquitoes, **West Nile fever** is primarily transmitted by Culex species.
Explanation: ***Generation time*** - This is defined as the time interval between **entry of an infective agent into a host** until the host develops **maximal infectivity**. - It represents the period from infection to when an infected individual is most capable of transmitting the disease to others. - This term precisely matches the question's definition and is crucial for understanding disease transmission dynamics. *Incubation period* - The incubation period is the time from exposure to an infectious agent until the onset of **clinical symptoms** in the host. - It ends at symptom onset, not at maximal infectivity (which may occur before, during, or after symptom onset depending on the disease). - While infectivity may peak during or near the incubation period for some diseases, this term specifically refers to symptom development, not infectivity capacity. *Serial interval* - The serial interval is the time between the onset of symptoms in a **primary case** and the onset of symptoms in a **secondary case**. - This describes the time between successive cases in a transmission chain, not the development of infectivity in an individual host. *Period of communicability* - This is the **entire duration** during which an infected person can transmit the infectious agent to others. - It describes the total infectious period (from start to end of infectivity), not specifically the time until **maximal** infectivity is reached.
Explanation: ***67*** - **Correct calculation for ANM pregnancy registration**: - Annual births = (25/1000) × 5000 = **125 births per year** - Monthly births = 125 ÷ 12 = **10.42 births per month** - **Active pregnancy follow-up period** = 6.5 months (from early second trimester until delivery) - Expected pregnancies registered = (125 ÷ 12) × 6.5 = 10.42 × 6.5 = **67.7 ≈ 67** - **Rationale**: The ANM (Auxiliary Nurse Midwife) typically provides active antenatal care from the second trimester (around 3-4 months) through delivery. This represents approximately 6.5 months of the 9-month pregnancy period. The calculation accounts for the number of women currently under active ANC supervision at any given time. - **Key formula**: Number of pregnancies = (Annual births ÷ 12) × Active follow-up months *Incorrect Option 69* - Would imply 6.6 months of active follow-up: 69 ÷ 10.42 = 6.62 months - This overestimates the standard ANC registration period *Incorrect Option 66* - Would imply 6.3 months of active follow-up: 66 ÷ 10.42 = 6.33 months - This underestimates the expected ANC registration period *Incorrect Option 68* - Would imply 6.53 months of active follow-up: 68 ÷ 10.42 = 6.53 months - Close to the standard calculation but less precise than 67 when using the 6.5-month follow-up period
Explanation: ***Inverse*** * Studies have often shown an **inverse relationship** between water hardness and cardiovascular disease mortality. * This means that areas with **harder drinking water**, which contains more minerals like calcium and magnesium, tend to have **lower rates of cardiovascular disease deaths**. *Direct* * A direct association would imply that **harder water leads to higher death rates**, which is generally not supported by epidemiological evidence. * If the relationship were direct, promoting soft water consumption might be a public health goal for cardiovascular health, which is not the case. *No association* * While the association isn't universally strong or consistently replicated in all studies, many large-scale epidemiological studies suggest a **protective effect** of hard water components. * Therefore, stating no association completely would ignore a significant body of research suggesting a benefit. *Association is obtained in presence of confounders* * While **confounders** (such as diet, lifestyle, socioeconomic status, and other geographical factors) are always a consideration in epidemiological studies, many analyses have attempted to control for these variables. * The observed inverse association often persists even after adjusting for known confounders, suggesting it's not solely due to them.
Explanation: **Case control and Cohort studies** - **Case-control studies** effectively identify **risk factors** by comparing exposure histories between individuals with a disease (cases) and those without (controls). - **Cohort studies** directly estimate the **degree of risk** (e.g., relative risk, incidence rates) by following exposed and unexposed groups over time to observe disease development. *Cohort study and Randomized control trial* - While **cohort studies** identify risk factors, **randomized controlled trials (RCTs)** primarily evaluate the **efficacy of interventions** by randomly assigning exposure. - RCTs are ethically difficult to use for identifying harmful risk factors directly, as intentionally exposing participants to potential harm is generally not permissible. *Cohort study and Ecological studies* - **Ecological studies** examine disease rates and exposures at a **population level**, making them useful for generating hypotheses but not for establishing individual-level risk factors or degrees of risk due to the **ecological fallacy**. - They cannot directly link individual exposure to individual outcome. *Case control and Cross-sectional studies* - **Cross-sectional studies** assess prevalence and provide a snapshot of health status and exposure at a single point in time, but they cannot establish **temporality** or the degree of association between exposure and outcome. - They are useful for describing prevalence but not for inferring causality or precise risk.
Explanation: ***4.80*** - **Relative Risk (RR)** = Risk in exposed / Risk in unexposed - From the table provided: - **OC users (exposed):** 120 developed PE out of 200 women → Risk = 120/200 = 0.60 - **Non-OC users (unexposed):** 10 developed PE out of 80 women → Risk = 10/80 = 0.125 - **RR = 0.60 / 0.125 = 4.8** - This indicates OC users have **4.8 times higher risk** of developing pulmonary embolism compared to non-users - This significant association aligns with known **thrombogenic effects** of estrogen-containing oral contraceptives - **Clinical relevance:** Highlights importance of screening for VTE risk factors before prescribing OCs *0.24* - This value would result from incorrect calculation or misinterpretation of table values - Does not represent any valid epidemiological measure from the given data *0.48* - This is simply the decimal misplacement of 4.8 divided by 10 - Results from calculation error, not proper relative risk computation *2.40* - This is exactly half of the correct answer (4.8/2) - May result from using wrong numerator or denominator values - Does not represent the correct relative risk calculation
Explanation: ***66.6 %*** - The **secondary attack rate (SAR)** is calculated by dividing the number of new cases among susceptible contacts by the total number of susceptible contacts. - In this scenario, there are 3 susceptible children (the index case came from the 4 children, leaving 3 susceptible), and 2 of them developed measles, making the SAR (2/3) * 100 = **66.6%**. *40 %* - This percentage would be obtained if you incorrectly included the immune parents in the susceptible population or used the total family size in the denominator for susceptible individuals. - **Parents are immune**, hence they are not at risk, and should not be included in the denominator for calculating SAR among susceptible contacts. *50 %* - This would be the SAR if either 1 out of 2 susceptible contacts became ill, or 2 out of 4 susceptible contacts became ill. - In this case, 2 out of 3 susceptible children developed measles, not 2 out of 4, therefore this option is incorrect. *33.3 %* - This percentage would result if only 1 out of the 3 susceptible children developed measles, or 2 out of 6 total family members (including parents) who were susceptible fell ill. - Since **2 out of 3 susceptible children** became infected, this option is incorrect.
Explanation: ***Ratio of observed number of deaths to the expected number of deaths in a population*** - The **Standardized Mortality Ratio (SMR)** is calculated as: **SMR = (Observed deaths / Expected deaths) × 100** - It compares the actual number of deaths observed in a study population to the number that would be expected based on standard population mortality rates, after adjusting for factors like age and sex distribution - **SMR = 100** indicates observed mortality equals expected mortality - **SMR > 100** indicates higher mortality than expected; **SMR < 100** indicates lower mortality than expected - This is the most accurate definition among the given options *New spells of disease in a given period of time per 1000 population* - This describes **incidence rate**, which measures the rate at which new cases of disease occur in a population over a specified time period - Incidence focuses on disease occurrence, not mortality or standardized comparisons *Number of deaths in a given period of time per 1000 population* - This defines the **crude death rate** or **crude mortality rate**, which is a simple count of total deaths per unit population in a given period - It does not involve standardization or comparison to expected deaths based on a reference population, which is the key feature of SMR *Percentage of deaths in women as compared to deaths in men* - This describes a **sex-specific mortality comparison** or proportionate mortality by gender - It does not relate to the concept of standardization against expected mortality rates, which is fundamental to SMR
Explanation: **8/3** - The **odds ratio** is calculated using the formula (a×d) / (b×c) from a 2×2 contingency table. - Setting up the table: Cases (breast cancer) vs Controls (no breast cancer) by exposure (obesity status) - a = obese cases = 120 - b = obese controls = 60 - c = non-obese cases = 300 - 120 = 180 - d = non-obese controls = 300 - 60 = 240 - **Odds ratio = (120 × 240) / (60 × 180) = 28,800 / 10,800 = 8/3** - This indicates that **obese women have 2.67 times the odds** of developing breast cancer compared to non-obese women. *11/5* - This answer suggests an **incorrect calculation** of the odds ratio, likely due to misassignment of values in the 2×2 table or an arithmetic error. - The result (2.2) does not match the correct cross-product ratio from the given data. *11/3* - This value is not derived from the correct **odds ratio** calculation using the given data. - Errors in setting up the 2×2 table or confusing which cells represent **exposed cases**, **exposed controls**, **unexposed cases**, and **unexposed controls** lead to such incorrect results. *9/5* - This option would result from an **incorrect placement** of values when calculating the cross-product ratio. - Possibly from reversing the numerator and denominator components or miscalculating the unexposed groups.
Principles of Epidemiology
Practice Questions
Measures of Disease Frequency
Practice Questions
Epidemiological Study Designs
Practice Questions
Descriptive Epidemiology
Practice Questions
Analytical Epidemiology
Practice Questions
Experimental Epidemiology
Practice Questions
Screening for Disease
Practice Questions
Surveillance Systems
Practice Questions
Investigation of an Epidemic
Practice Questions
Association and Causation
Practice Questions
Modern Epidemiological Methods
Practice Questions
Critical Appraisal of Epidemiological Studies
Practice Questions
Get full access to all questions, explanations, and performance tracking.
Start For Free