Which one of the following experiments/trials is a part of non-randomized trials?
A well of contaminated water resulted in an outbreak of diarrhoea in a community. Which type of epidemic will this exposure present with? 1.Propagated epidemic 2.Common source - continuous exposure 3.Common source - point exposure
The yield of a screening test CAN NOT be increased by which of the following?
What are the characteristics of ideal health indicators?
After attending a birthday party in a hostel around 50 students reported having loose stools, fever and a few reported vomiting. This outbreak can be identified as what type of outbreak ?
In a town with one lakh population (1,00,000) there are a total of 2500 live births in a year. There were 75 total deaths of children before the age of one month, total 200 deaths before the age of one year, and a total 300 deaths before the age of three years. Which of the following statements regarding Infant Mortality Rate (IMR) of the town for the given year are correct? 1. The denominator is 1,00,000 2. The IMR of the town is higher than the current national average of IMR for India 3. The numerator is the number of children dying before the age of one month 4. The IMR of the town is 80 per 1000 live births
Which one of the following is a famous large prospective study that helped establish risk factors for coronary heart disease ?
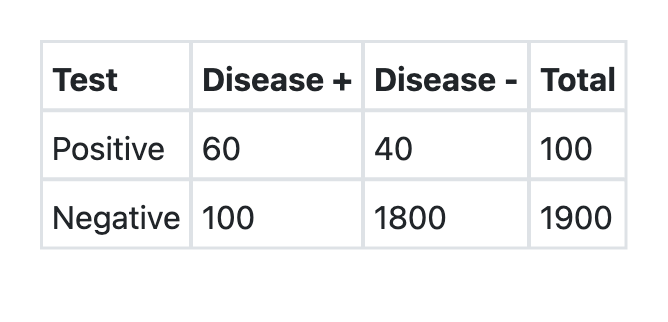
A new test was developed for detection of COVID-19. What is the sensitivity of the test as per the information provided above?

Which one of the following best explains the relationship among Prevalence (P), Incidence (I) and Duration (D) of a disease given the assumption that the population is stable ?
In which one of the following study designs, the unit of study involves populations rather than individuals ?
Explanation: ***Uncontrolled trial*** - An **uncontrolled trial** is a single-arm study where all participants receive the same intervention without any control group for comparison. - These are classified as **non-randomized trials** because there is no random allocation between groups (as there is only one group). - Common in early phase drug studies or when ethical considerations prevent withholding treatment. *Before and after comparison studies* - While these are **non-randomized designs**, they are typically classified as **quasi-experimental studies** rather than trials in strict epidemiological terminology. - They measure outcomes in the same population before and after an intervention without random allocation. *Natural experiment* - A **natural experiment** is an **observational study design**, not an experimental trial. - Researchers observe the effects of naturally occurring events or policy changes without any deliberate intervention or random assignment by the investigator. - Example: Comparing health outcomes before and after a public health policy change. *Risk factor trial* - This term is **not standard epidemiological terminology** for trial classification. - Trials are typically classified by design (randomized vs non-randomized) and control status (controlled vs uncontrolled), not by whether they study risk factors. - Most risk factor research uses observational cohort or case-control studies, not trials.
Explanation: ***3 only*** - A **common source - point exposure** epidemic occurs when a group of people are exposed to the same harmful source over a relatively **short, defined period**. A contaminated well represents a single source of exposure, and the diarrhea outbreak suggests a rapid onset of illness within the community after this exposure. - The contamination of a well provides a **single, acute event** where affected individuals are exposed around the same time leading to a sharp increase in cases, followed by a decline. *1, 2 and 3* - This option is incorrect because a **propagated epidemic** typically involves person-to-person transmission, which is not the primary mode described for a contaminated water source that causes a widespread outbreak. - A **common source - continuous exposure** involves ongoing or intermittent exposure over a prolonged period, leading to a flatter epidemic curve or multiple peaks, which is less likely for a singular contaminated well event unless the contamination lasts for an extended time. *2 only* - This is incorrect because **common source - continuous exposure** implies prolonged or repeated exposure to the source, potentially due to ongoing contamination of the well, leading to cases occurring over an extended period. - While a contaminated well could potentially lead to continuous exposure if the contamination persists and goes unaddressed, the phrasing "a well of contaminated water resulted in an outbreak" suggests an event with a more defined timeline, fitting point exposure initially. *1 and 2 only* - This option is incorrect because a **propagated epidemic** is characterized by the spread of disease from person to person, often resulting in multiple waves of cases, which is not the primary pattern expected from a contaminated water source. - While continuous exposure could describe a contaminated well that remains active, the initial description of "an outbreak" from a single source often points more directly to a **point exposure** event in its initial phase.
Explanation: ***Including entire population*** - Including the entire population, especially if it contains many individuals at **low risk** for the disease, would lead to a larger number of tests performed with a comparatively lower number of positive results, thus **decreasing the yield**. - **Screening yield** refers to the proportion of positive test results in the screened population or the number of new cases identified, and including a large low-risk group dilutes this proportion. *Including high risk population* - Targeting a **high-risk population** increases the **prevalence** of the disease within the screened group, leading to more true positives and a higher yield. - This strategy ensures that screening resources are focused on those most likely to benefit from early detection. *Improved sensitivity* - A screening test with **improved sensitivity** is better at identifying individuals who truly have the disease, leading to fewer **false negatives**. - By increasing the detection rate of actual cases, higher sensitivity directly contributes to a **greater screening yield** by detecting more true positive cases. *Improved specificity* - A screening test with **improved specificity** is better at correctly identifying individuals who do not have the disease, leading to fewer **false positives**. - However, improved specificity **does not increase the number of true cases detected**—it only reduces false positives, thus improving the **positive predictive value (PPV)** but not necessarily the screening yield itself. - While it makes positive results more reliable, it does not contribute to finding more actual disease cases in the population.
Explanation: ***They should be valid, reliable, sensitive, specific, feasible and relevant*** - Ideal health indicators must possess **all six characteristics** to be truly effective for public health assessment and decision-making - **Validity** ensures they measure what they're intended to measure - **Reliability** guarantees consistent and reproducible results - **Sensitivity** detects all true positive cases (minimizes false negatives) - **Specificity** correctly identifies true negatives (minimizes false positives) - **Feasibility** makes them practical, cost-effective, and routinely collectable - **Relevance** ensures they are meaningful for health policy and programmatic decisions *They should be mainly valid, reliable and relevant but need not be feasible* - While **validity**, **reliability**, and **relevance** are crucial, neglecting **feasibility** would render indicators impractical and costly to implement - An indicator that cannot be routinely collected or analyzed due to resource constraints is not ideal for ongoing public health surveillance, regardless of its statistical soundness *They should be mainly valid, reliable and sensitive but need not be specific* - While **validity**, **reliability**, and **sensitivity** are important, a lack of **specificity** would lead to a high number of **false positives** - This results in misallocation of scarce resources and unnecessary interventions for individuals who are not truly affected by the health condition being monitored *They should be mainly valid, reliable and feasible but need not be sensitive* - While **validity**, **reliability**, and **feasibility** are essential, an indicator that lacks **sensitivity** would miss a significant number of actual cases (**false negatives**) - This means the true burden of disease or health problem could be underestimated, leading to inadequate public health responses and insufficient allocation of interventions
Explanation: ***Common point source only*** - This outbreak shows all characteristics of a **common point source (point source) outbreak** where multiple individuals were exposed to the same contaminated source at a **single time and place** (the birthday party). - The symptoms (loose stools, fever, vomiting) all represent **clinical manifestations of food poisoning**, not evidence of secondary transmission. - Common point source outbreaks typically show a **sharp rise in cases followed by a rapid decline**, with all cases occurring within **one incubation period** of the exposure. - This is the classic pattern seen in **foodborne outbreaks** at events like parties, weddings, or gatherings. *Both propagated and common point source* - There is **no evidence of person-to-person transmission** or secondary cases in this scenario. - Vomiting is simply a **symptom of the foodborne illness**, not an indicator of propagated spread. - A mixed outbreak would require evidence of **successive waves of cases** beyond the initial exposure, which is not described here. *Common source continuous* - Continuous common source outbreaks occur when exposure to the contaminated source is **prolonged or intermittent** over time, creating a plateau in the epidemic curve. - This scenario describes a **single event** (birthday party) with acute exposure, not ongoing contamination. - Examples of continuous source outbreaks include contaminated water supplies or ongoing food contamination at a restaurant. *Propagated only* - Propagated outbreaks are characterized by **person-to-person transmission** leading to successive waves of cases over **multiple incubation periods**. - This scenario has a clear **point source exposure** (birthday party) as the initiating event, not person-to-person spread. - Examples of propagated outbreaks include measles, chickenpox, or other communicable diseases spreading through a population.
Explanation: **IMR Formula:** Infant Mortality Rate = (Number of deaths under 1 year of age / Total live births in the same year) × 1000 **Analysis of each statement:** **Statement 1:** "The denominator is 1,00,000" - **INCORRECT** - The denominator for IMR is the **total number of live births (2,500)**, not the total population (1,00,000) - Population is not used in IMR calculation **Statement 2:** "The IMR of the town is higher than the current national average of IMR for India" - **CORRECT** - Calculated IMR = (200 deaths / 2,500 live births) × 1000 = **80 per 1000 live births** - India's current national IMR ≈ 27-28 per 1000 live births (as of 2020-2022 data) - 80 is significantly higher than the national average **Statement 3:** "The numerator is the number of children dying before the age of one month" - **INCORRECT** - The numerator for IMR is **deaths before the age of one year (200)**, not before one month - Deaths before one month (75) constitute the numerator for **Neonatal Mortality Rate**, not IMR **Statement 4:** "The IMR of the town is 80 per 1000 live births" - **CORRECT** - Calculation: (200 / 2,500) × 1000 = 80 per 1000 live births - This is the accurate IMR for the town ***Correct Answer: 2 and 4 only*** - Both statements 2 and 4 are correct as shown above - Statements 1 and 3 contain fundamental errors about the IMR formula components
Explanation: ***Framingham study*** - The **Framingham Heart Study** is a landmark **long-term prospective cohort study** that began in 1948 in Framingham, Massachusetts, to identify common factors or characteristics that contribute to **cardiovascular disease (CVD)**. - This study has been instrumental in identifying major **CVD risk factors** such as high blood pressure, high cholesterol, smoking, obesity, diabetes, and physical inactivity. *Pittsburgh study* - While Pittsburgh is a hub for medical research, there isn't a single "Pittsburgh study" that holds the same widespread recognition for establishing **cardiovascular risk factors** as the Framingham study. - Various studies from Pittsburgh institutions might contribute to cardiovascular research, but none are as globally recognized for this specific contribution. *Adelaide study* - The "Adelaide study" generally refers to research conducted in Adelaide, Australia, which has produced various medical findings. - However, it is not known as a prominent, large-scale prospective study specifically designed to establish widespread **coronary heart disease risk factors** in the same league as the Framingham Heart Study. *Birmingham study* - Many medical studies are conducted in Birmingham (both in the UK and USA), but there isn't one definitive "Birmingham study" with the historical significance and impact on identifying **coronary heart disease risk factors** that the Framingham study has. - Research from Birmingham typically contributes to various medical fields, but not specifically as the primary source for these fundamental risk factor discoveries.
Explanation: ***37.5%*** - **Sensitivity** is calculated as the number of **true positives** divided by the sum of true positives and false negatives (i.e., total number of individuals with the disease). - From the table, **True Positives (Test Positive and Disease +)** = 60, and **False Negatives (Test Negative and Disease +)** = 100. So, sensitivity = 60 / (60 + 100) = 60 / 160 = 0.375 or 37.5%. *97%* - This value is incorrect. It might be confused with **Negative Predictive Value (NPV)**, which is the probability that subjects with a negative test truly don't have the disease (1800/1900 ≈ 0.947 or 94.7%), but it's not 97%. - It does not correctly represent the calculation for sensitivity as described above. *20.5%* - This value is incorrect. It does not correspond to any standard epidemiological measure of test performance based on the provided data. - This percentage might arise from an incorrect division or addition of values from the table. *60%* - This value is incorrect. While 60 **true positives** are present, sensitivity requires dividing this by the total number of diseased individuals, not just any other total. - This could be confused with the ratio of true positives to total positive tests (Positive Predictive Value), which would be 60/100, resulting in 60%, but this is not sensitivity.
Explanation: **Fundamental Epidemiological Relationship:** In a stable population with endemic disease, the relationship between prevalence, incidence, and duration is expressed as: **Prevalence = Incidence × Average Duration (P = I × D)** ***P = I × D*** - This is the **correct formula** that describes the relationship under conditions of a **stable population** and **endemic disease**. - Prevalence is directly proportional to both the incidence rate and the average duration of the disease. - This formula reflects that the number of existing cases (prevalence) equals the rate at which new cases occur (incidence) multiplied by how long people have the disease (duration). - Example: If incidence = 10 cases/1000/year and average duration = 5 years, then prevalence = 50 cases/1000. *I = P × D* - This formula incorrectly suggests that incidence increases with both prevalence and duration. - This would mean that longer disease duration causes higher incidence, which is illogical. - Correctly rearranged, this would be I = P/D (incidence equals prevalence divided by duration). *D = P × I* - This formula incorrectly states that duration is the product of prevalence and incidence. - This would mean higher incidence causes longer duration, which is epidemiologically incorrect. - Correctly rearranged, this would be D = P/I (duration equals prevalence divided by incidence). *I = P + D* - This formula implies a simple additive relationship, which is **epidemiologically invalid**. - Prevalence, incidence, and duration are related **multiplicatively**, not additively, in a steady state. - This equation has no basis in epidemiological theory.
Explanation: ***Correct: Ecological studies*** - **Ecological studies** analyze health-related data at a population level, such as countries or communities, rather than individual patients. - They are used to observe correlations between exposure and outcome among different groups or over time. - The unit of analysis is the **population or group**, not individuals. *Incorrect: Cross-sectional studies* - **Cross-sectional studies** examine individuals at a single point in time to determine the prevalence of a disease or exposure. - While they can describe populations, the unit of observation and analysis remains the **individual**. *Incorrect: Cohort studies* - **Cohort studies** follow groups of individuals (cohorts) over time to investigate the incidence of an outcome and its association with specific exposures. - The primary unit of study is the **individual**, who is tracked for disease development. *Incorrect: Case-control studies* - **Case-control studies** compare individuals with a disease (cases) to individuals without the disease (controls) to identify past exposures. - This design focuses on **individual-level data** to determine risk factors.
Principles of Epidemiology
Practice Questions
Measures of Disease Frequency
Practice Questions
Epidemiological Study Designs
Practice Questions
Descriptive Epidemiology
Practice Questions
Analytical Epidemiology
Practice Questions
Experimental Epidemiology
Practice Questions
Screening for Disease
Practice Questions
Surveillance Systems
Practice Questions
Investigation of an Epidemic
Practice Questions
Association and Causation
Practice Questions
Modern Epidemiological Methods
Practice Questions
Critical Appraisal of Epidemiological Studies
Practice Questions
Get full access to all questions, explanations, and performance tracking.
Start For Free