Chandler’s index is used in the epidemiological studies of
When the prevalence rate is used without any qualification, it is taken to mean as
Which of the following Screening methods for Disease is the least useful?
By which one of the following studies can relative risk be best calculated?
Which of the following is/are suggested by rising incidence rates of any disease? 1. Need for a new disease control programme 2. Improvement in reporting practices 3. Change in the etiology of the disease Select the correct answer using the codes given below:
Which of the following types of study designs will be most appropriate to find out the association between mobile phone radiation exposure and cancer?
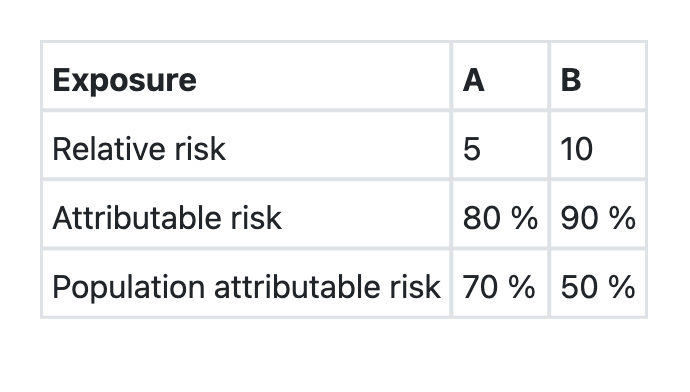
The data regarding two exposures A and B, associated with a disease X in a community is given below: Which one of the following assertions and the reasons given is correct?

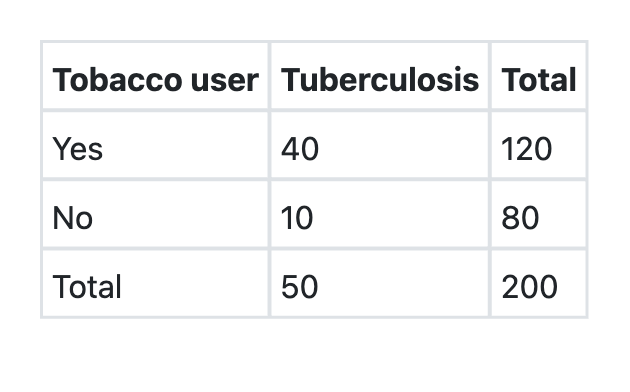
A cohort study was conducted among 200 men aged 20–30 years in Rampur village. Out of 200, 120 men were tobacco users and rest 80 didn’t take any form of tobacco. At the end of one year, 40 men among tobacco users and 10 men among non-tobacco users developed tuberculosis. The incidence of tuberculosis among tobacco users is:
What is the attributable risk percent (etiologic fraction) of tobacco for developing tuberculosis as per the information given below? Tobacco users Tuberculosis Total Present Absent Yes 40 80 120 No 10 70 80 Total 50 150 200
What is the relative risk of developing tuberculosis among tobacco users as per the information given below?

Explanation: **Hookworm infection** - Chandler's index is a specific epidemiological measure used to estimate the **worm burden** in a community, which is particularly relevant for **hookworm infections**. - It relates the **hemoglobin level** in a population to the prevalence of hookworm, as hookworms cause **iron deficiency anemia**. *Ascariasis* - While *Ascaris lumbricoides* is a common intestinal nematode, Chandler's index is not specifically developed for assessing its epidemiological impact. - Ascariasis typically causes **malnutrition** and occasional **bowel obstruction** rather than severe anemia as its primary public health impact. *Taenia solium infection* - *Taenia solium* causes **taeniasis** (intestinal tapeworm) and **cysticercosis** (tissue infection with larvae). - Its epidemiological study focuses on human-pig cycles and neurological manifestations, not anemia as measured by Chandler's index. *Guineaworm disease* - **Guineaworm disease** (dracunculiasis) is caused by *Dracunculus medinensis* and is acquired by drinking contaminated water. - Epidemiological studies focus on water sources and containment, and it does not typically cause **anemia** or use an index like Chandler's.
Explanation: ***point prevalence rate*** - When the term "prevalence rate" is used without any further specification, it is generally understood to refer to the **point prevalence rate**. - This measures the **proportion of individuals** in a population who have a disease or health condition at a **specific point in time**. *period prevalence rate* - The **period prevalence rate** refers to the proportion of individuals who have a disease or condition over a **specified period of time** (e.g., a year). - It is a cumulative measure over a duration, unlike the instantaneous 'point' measure. *mean duration prevalence rate* - There isn't a standard epidemiological measure specifically termed "mean duration prevalence rate." - Prevalence is related to duration, but this is a **statistical relationship** (Prevalence = Incidence x Duration), not a standard direct prevalence measure itself. *annual prevalence rate* - The **annual prevalence rate** is a type of **period prevalence rate** that specifically covers a one-year period. - While common, it is a specific qualification of prevalence, not the default meaning when "prevalence rate" is used generally.
Explanation: ***Mass screening*** - Mass screening is the **least useful** screening method when applied indiscriminately to entire unselected populations, particularly for diseases with **low prevalence**. - This approach tests everyone regardless of risk factors, making it highly **resource-intensive** with low efficiency and poor **positive predictive value** for rare conditions. - The high rate of **false positives** leads to unnecessary follow-up investigations, patient anxiety, and wastage of healthcare resources, making it the least cost-effective screening strategy. *Selective screening* - **Selective screening** targets specific high-risk groups or individuals with certain exposures, significantly improving the **yield** and **cost-effectiveness** of the screening program. - This approach focuses resources where the **prevalence of disease** is higher, increasing the likelihood of detecting true cases and reducing false positives compared to mass screening. *High risk group screening* - **High-risk group screening** focuses on individuals with known risk factors, family history, or exposures that significantly increase their likelihood of developing a disease. - This method is highly effective for diseases with clear risk profiles, as it maximizes the **positive predictive value** of the screening test and optimizes resource allocation. *Multiphasic screening* - **Multiphasic screening** involves the simultaneous application of multiple screening tests to detect several conditions at once during a single healthcare encounter. - This approach can be efficient for detecting multiple prevalent diseases in certain populations, offering comprehensive health assessment while being more useful than mass screening due to its targeted nature.
Explanation: ***Cohort study*** - A cohort study directly follows groups of individuals (cohorts) over time to observe the **incidence of disease** in exposed versus unexposed groups. - This design allows for the direct calculation of **absolute risks** in each group, from which the **relative risk** can be easily derived. *Correlation study* - A correlation study examines the **relationship between variables** in a population, often using aggregated data, but does not follow individuals over time to assess incidence. - It can identify associations between exposures and outcomes but cannot calculate relative risk directly because it does not provide individual risk data. *Case-control study* - A case-control study compares individuals with a disease (cases) to individuals without the disease (controls) and looks back in time to determine past exposures. - While it can estimate the **odds ratio**, which approximates relative risk when the disease is rare, it cannot directly calculate relative risk because it does not provide the incidence of the disease in exposed versus unexposed populations. *Randomised control trial* - A randomized controlled trial (RCT) is an experimental study where participants are randomly assigned to an intervention or control group to assess the efficacy of an intervention. - While RCTs can calculate relative risk, they are primarily designed to establish **causality** and intervention effectiveness, not to investigate risk factors in naturally occurring populations in the same way a cohort study does for epidemiological insight.
Explanation: ***1, 2 and 3*** - **Rising incidence rates** can suggest multiple scenarios in epidemiology: **Statement 1 - Need for a new disease control programme**: A true increase in incidence indicates rising disease burden, which may necessitate public health intervention through disease control programs, surveillance strengthening, or prevention strategies. **Statement 2 - Improvement in reporting practices**: Enhanced surveillance systems, better diagnostic capabilities, increased healthcare access, or improved physician awareness can lead to more cases being detected and reported. This creates an *apparent* rise in incidence without a true increase in disease occurrence (surveillance artifact). **Statement 3 - Change in the etiology of the disease**: While etiology (causation) itself typically doesn't change, this statement refers to changes in **risk factors, exposure patterns, environmental conditions, or pathogen characteristics** (such as emergence of more virulent strains, antimicrobial resistance, or vector behavior changes) that can genuinely increase disease incidence. All three statements represent valid interpretations of rising incidence rates in epidemiological practice. *2 and 3 only* - This incorrectly excludes the public health implication that rising incidence may warrant new disease control programs, which is a fundamental principle of public health response. *1 and 3 only* - This overlooks the critical role of **surveillance artifacts** where improved reporting practices can increase observed incidence without true disease increase—a common phenomenon in epidemiology. *1 only* - This is too restrictive, failing to recognize that rising incidence can result from multiple factors including improved detection systems and genuine changes in disease transmission dynamics or risk factor exposure.
Explanation: ***Case-control*** - **Among the given options**, case-control studies are most appropriate for investigating the association between mobile phone radiation exposure and cancer. - **Case-control studies** are efficient for investigating rare outcomes like cancer, by comparing exposure histories between individuals with the disease (cases) and those without (controls). - This design allows for studying factors potentially linked to disease despite **long latency periods**. - However, note that **cohort studies** would be even more ideal for this research question as they better establish temporal relationships and minimize recall bias, which is why major studies like the INTERPHONE study used cohort designs. But cohort studies are not among the options provided. *Cross-sectional* - **Cross-sectional studies** assess exposure and outcome simultaneously, making it difficult to establish temporal relationship or causation. - They are suitable for estimating prevalence but not for investigating etiology of diseases with long latency periods like cancer. *Case-series* - A **case series** describes characteristics of a group of patients with a particular disease, but lacks a comparison group. - It cannot establish an association between exposure and outcome, as there is no control for confounding factors. *Single-arm interventional* - A **single-arm interventional study** involves administering an intervention to a single group and observing the outcome, primarily for evaluating efficacy or safety of new treatments. - It is not designed to investigate associations between environmental exposures (like mobile phone radiation) and disease, as it lacks a control group and focuses on interventions rather than observational epidemiology.
Explanation: ***Preference to control exposure A, because it has a higher population attributable risk*** - **Population Attributable Risk (PAR)** quantifies how much of the disease incidence in the *total population* can be attributed to a specific exposure. When deciding on public health interventions, controlling the exposure with the highest PAR will have the **greatest impact on reducing the disease burden** in the community. - In this case, exposure A has a PAR of 70%, meaning 70% of disease X cases in the community can be prevented by eliminating exposure A, while exposure B has a PAR of 50%. Therefore, prioritizing preventive measures for exposure A is more effective from a public health perspective. *Cannot decide, as the precedence of exposure in the community has not been mentioned* - The decision on which exposure to control is primarily based on its **potential impact on public health**, which is best reflected by the Population Attributable Risk (PAR). - The "precedence of exposure" (e.g., which exposure came first or is more fundamental) is not typically the primary factor for public health priority setting when quantitative measures like PAR are available. *Preference to control exposure B, because it has a higher attributable risk* - **Attributable Risk (AR)**, also known as the attributable fraction among the exposed, indicates the proportion of disease among *exposed individuals* that is due to the exposure. While B has a higher AR (90% vs. 80%), this metric does not account for the prevalence of the exposure in the overall population. - A high AR for an exposure that is rare in the population might have less overall public health impact than a lower AR for a very common exposure, which is why PAR is a better guide for population-level interventions. *Preference to control exposure B as it has a higher relative risk* - **Relative Risk (RR)** indicates the strength of the association between an exposure and a disease (i.e., how many times more likely exposed individuals are to develop the disease compared to unexposed individuals). Exposure B has a higher RR (10 vs. 5). - While a higher RR signifies a stronger association, it does not tell you the overall impact on the *community*. An exposure with a very high RR but low prevalence might contribute less to the total disease burden in the population than an exposure with a moderate RR but high prevalence, which is again why PAR is preferred for public health decision-making.
Explanation: ***33.3 per 100 men/year*** - **Incidence of tuberculosis among tobacco users** is calculated as (Number of new cases among tobacco users / Total number of tobacco users) × 100. - In this study, (40 / 120) × 100 = **33.3 per 100 men/year**. - This is the correct application of the **incidence rate formula** for the exposed group. *30.0 per 100 men/year* - This figure does not correspond to any standard epidemiological calculation for this study. - It may result from mathematical error or confusion with other rates. - The correct calculation for tobacco users yields 33.3, not 30.0. *12.5 per 100 men/year* - This value represents the **incidence among non-tobacco users** (10/80 × 100 = 12.5). - This answers a different question - the incidence in the unexposed group. - The question specifically asks for incidence among **tobacco users**, not non-users. *25.0 per 100 men/year* - This represents the **overall incidence** in the entire cohort: (40 + 10) / (120 + 80) × 100 = 50/200 × 100 = 25.0. - This is the total population incidence, not specific to tobacco users. - The question asks for incidence among tobacco users specifically, which requires using tobacco users as the denominator.
Explanation: ***62.5%*** - The **risk of TB in tobacco users** is 40/120 = 0.333 (33.3%). The **risk of TB in non-tobacco users** is 10/80 = 0.125 (12.5%). - The **attributable risk (AR)** is calculated as: Risk in exposed – Risk in unexposed = 0.333 - 0.125 = 0.208 - The **attributable risk percent (AR%)** or **etiologic fraction** is: [(Risk in exposed – Risk in unexposed) / Risk in exposed] × 100 - AR% = (0.208 / 0.333) × 100 = **62.5%** - This represents the **proportion of disease in the exposed group that can be attributed to the exposure** (tobacco use). *70.6%* - This value does not result from the correct attributable risk percent formula using the provided data. - This might arise from incorrectly calculating the population attributable risk or from computational errors. *50.5%* - This percentage does not result from the appropriate calculation of attributable risk percent. - This may result from calculation errors or misapplication of the formula components. *80.6%* - This value is inconsistent with the correct calculation based on the given data. - This could result from using incorrect ratios or misunderstanding which values belong in the formula.
Explanation: **2.67** - To calculate the **relative risk**, we first need to determine the incidence Proportion (IP) of TB in tobacco users and non-tobacco users. - **IP for tobacco users** = (Number of tobacco users with TB) / (Total number of tobacco users) = 40/120 = 0.33. - **IP for non-tobacco users** = (Number of non-tobacco users with TB) / (Total number of non-tobacco users) = 10/80 = 0.125. - **Relative Risk** (RR) = IP of exposed / IP of unexposed = 0.33 / 0.125 = 2.67. *3.90* - This value would be obtained if there was an error in calculating the incidence proportions or the division. - For example, if the calculation for the incidence proportion of non-tobacco users was incorrect. *0.48* - A relative risk value less than 1 would indicate that tobacco use is a **protective factor** against tuberculosis, meaning tobacco users are less likely to develop TB than non-users, which is not the case here. - This value might be obtained by inverting the relative risk calculation (**IP unexposed / IP exposed**). *1.33* - This value is significantly lower than the correct relative risk and would likely result from a miscalculation in the number of cases or total populations for either group. - For instance, if the incidence rate for tobacco users was underestimated or for non-tobacco users was overestimated.
Principles of Epidemiology
Practice Questions
Measures of Disease Frequency
Practice Questions
Epidemiological Study Designs
Practice Questions
Descriptive Epidemiology
Practice Questions
Analytical Epidemiology
Practice Questions
Experimental Epidemiology
Practice Questions
Screening for Disease
Practice Questions
Surveillance Systems
Practice Questions
Investigation of an Epidemic
Practice Questions
Association and Causation
Practice Questions
Modern Epidemiological Methods
Practice Questions
Critical Appraisal of Epidemiological Studies
Practice Questions
Get full access to all questions, explanations, and performance tracking.
Start For Free