Which among the following countries is a 'Rabies free country'?
Pearl's index indicates:
Which of the following terms denotes the approximate magnitude of completed family size?
What is the definition of an index case?
The 'dependency ratio' includes age groups that are:
What is the secondary attack rate of pertussis in unimmunized household contacts of a pertussis case?
What is a case-control study?
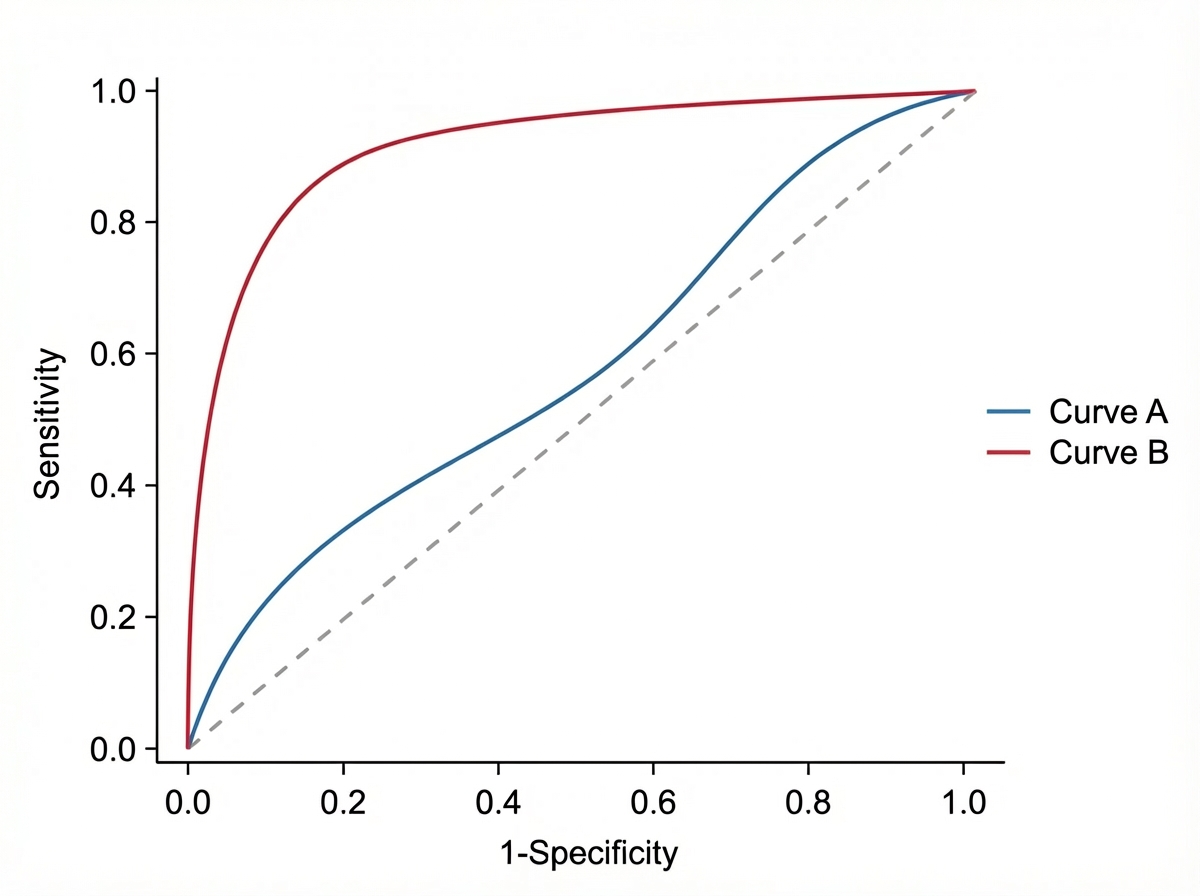
Observe the following curves. What will happen to Sensitivity and Specificity if the curve changes from Blue to Red?

What is the primary level of prevention?
The prevalence of a disease depends upon which of the following factors?
Explanation: **Explanation:** The correct answer is **Australia**. **Why Australia is the correct answer:** According to the World Health Organization (WHO) and the World Organisation for Animal Health (WOAH), Australia is classified as a **rabies-free country**. This status is maintained through strict quarantine laws and geographical isolation. While Australia does have the *Australian Bat Lyssavirus* (ABLV), which is closely related to the classical rabies virus, the country remains free of the classical rabies virus (*Rabies lyssavirus*) in its terrestrial animal populations. **Analysis of Incorrect Options:** * **USA:** Rabies is endemic in the United States, primarily circulating in wildlife such as raccoons, skunks, bats, and foxes. * **Russia:** Russia has a significant burden of rabies, particularly in its wild fox populations and domestic dogs in rural areas. * **France:** While France is technically "terrestrial rabies-free" (meaning no cases in non-flying mammals), it is not globally categorized as a rabies-free zone in the same definitive historical context as island nations like Australia or New Zealand, as it faces constant re-introduction risks from neighboring European borders. **NEET-PG High-Yield Pearls:** * **Rabies-Free Areas:** Other notable rabies-free regions include **New Zealand, Japan, United Kingdom, Iceland, and many Pacific Islands.** * **Incubation Period:** In humans, it is typically **1–3 months** but can range from <1 week to >1 year. * **The 100% Rule:** Rabies is nearly **100% fatal** once clinical symptoms appear, but **100% preventable** with timely Post-Exposure Prophylaxis (PEP). * **Island Status:** Most rabies-free countries are islands, which allows for easier control of animal movement.
Explanation: **Explanation:** **Pearl’s Index** is the standard epidemiological measure used to assess the **effectiveness of a contraceptive method**. It specifically calculates the **contraceptive failure rate** by determining the number of unintended pregnancies per 100 woman-years of exposure. The formula for Pearl’s Index is: $$\text{Pearl Index} = \frac{\text{Total accidental pregnancies} \times 1200}{\text{Total months of exposure (usage)}}$$ *(Note: 1200 represents 100 women multiplied by 12 months).* A lower Pearl Index indicates a more effective contraceptive method. For example, the Pearl Index for an IUD is significantly lower than that of barrier methods like condoms. **Analysis of Incorrect Options:** * **A. Malnutrition:** Assessed using indices like the Quetelet Index (BMI), Gomez classification, or Waterlow’s classification. * **B. Population:** Measured via demographic indicators such as Crude Birth Rate (CBR), Total Fertility Rate (TFR), or Net Reproduction Rate (NRR). * **C. Low Birth Weight (LBW):** Defined as a birth weight of less than 2500g; its prevalence is a key indicator of maternal nutritional status and newborn health. **High-Yield Clinical Pearls for NEET-PG:** * **Life Table Analysis:** This is considered superior to the Pearl Index because it calculates "failure rates" at specific intervals (month-by-month), accounting for users who drop out of a study. * **Theoretical vs. Typical Use:** Pearl Index varies based on "perfect use" (method failure) vs. "typical use" (user failure). * **Lowest Pearl Index:** Currently attributed to the **Implanon (Subdermal implant)**, followed by Vasectomy and IUDs.
Explanation: **Explanation:** The **Total Fertility Rate (TFR)** is the most sensitive indicator of fertility and is defined as the average number of children a woman would have if she were to pass through her entire reproductive years (15–49) experiencing the current age-specific fertility rates. It represents the **completed family size** because it sums up the fertility experience of a synthetic cohort of women across their entire reproductive span. **Analysis of Options:** * **Total Fertility Rate (Correct):** It is the best indicator of the magnitude of completed family size. A TFR of 2.1 is considered the "Replacement Level Fertility," at which a population exactly replaces itself from one generation to the next. * **General Fertility Rate (GFR):** This is the number of live births per 1000 women in the reproductive age group (15–49 years) in a year. While better than the Crude Birth Rate, it is a cross-sectional measure and does not account for age distribution or completed family size. * **Total Marital Fertility Rate (TMFR):** Similar to TFR, but the denominator is restricted to married women. While it reflects family size within marriage, it is not the standard demographic measure for the general population's completed family size. * **General Marital Fertility Rate (GMFR):** This measures the number of live births per 1000 **married** women in the reproductive age group. It is used to study fertility patterns specifically within the institution of marriage. **High-Yield Pearls for NEET-PG:** * **Replacement Level Fertility:** TFR = 2.1. * **Current Status (India):** According to NFHS-5, India’s TFR has reached **2.0**, which is below the replacement level. * **Net Reproduction Rate (NRR):** The number of daughters a newborn girl will bear during her lifetime. The goal of the National Health Policy is to achieve **NRR = 1** (which corresponds to a TFR of 2.1). * **Gross Reproduction Rate (GRR):** Similar to TFR but counts only female births; it does not account for maternal mortality.
Explanation: ### Explanation **1. Why Option D is Correct:** In epidemiology, the **Index Case** is defined specifically as the first case of a disease that comes to the attention of the investigator or health authorities. It is the "starting point" for an epidemiological investigation. Crucially, the index case is not necessarily the first person to have the disease in the community; rather, it is the first case **detected or reported**. **2. Analysis of Incorrect Options:** * **Option A:** This describes the **Primary Case**. The primary case is the actual first person to introduce the infection into a population. While the index case and primary case can be the same person, they often differ because the true first case may go unnoticed or unreported. * **Option B:** This describes a **Secondary Case**. These are individuals who contract the infection through contact with the primary case within the incubation period. * **Option C:** This describes a **Tertiary Case**, representing the subsequent wave of transmission in the community. **3. NEET-PG High-Yield Pearls:** * **Primary Case:** The person who brings the disease into the population. * **Index Case:** The person who brings the disease to the attention of the doctor/investigator. * **Secondary Attack Rate (SAR):** Measures the spread of disease from a primary case to contacts within the incubation period. It is an indicator of the **communicability** or infectiousness of an agent. * **Formula for SAR:** (Number of secondary cases among contacts / Total number of susceptible contacts) × 100. Note: The primary case is excluded from both the numerator and denominator.
Explanation: **Explanation:** The **Dependency Ratio** is a demographic indicator used to measure the economic burden on the productive portion of a population. It is defined as the ratio of the "dependent" population (those not typically in the labor force) to the "economically productive" population. **1. Why Option A is correct:** The dependency ratio is calculated using two distinct dependent groups in the numerator: children (0–14 years) and the elderly (65 years and older). Therefore, the age group **less than 15 years** is a primary component of the dependency ratio (specifically the *Young Age Dependency Ratio*). **2. Why other options are incorrect:** * **Option B:** The age group **15–64 years** represents the **economically productive** population. In the formula, this group serves as the **denominator**. They are the individuals supporting the dependents, not the dependents themselves. * **Option C:** While those **65 years and older** are indeed dependents (*Old Age Dependency Ratio*), the question structure in many competitive exams (including this specific NEET-PG recall) often focuses on the individual components. However, if the question asks what the ratio "includes" and "All of the above" is an option, it usually refers to the entire formula. In this specific key, Option A is highlighted as the primary demographic driver in developing nations like India. * **Option D:** This is incorrect because the "economically productive" group (Option B) is the inverse of a dependent. **High-Yield NEET-PG Pearls:** * **Formula:** $\frac{(\text{Population } 0-14) + (\text{Population } 65+)}{\text{Population } 15-64} \times 100$ * **Total Dependency Ratio:** Sum of Young and Old dependency ratios. * **Demographic Dividend:** Occurs when the dependency ratio declines due to a bulge in the working-age population (15–64 years). * **India Context:** In India, the numerator for old-age dependency is often calculated from **60+ years** instead of 65+, though international standards use 65.
Explanation: **Explanation** **1. Why the Correct Answer is Right (90%)** The **Secondary Attack Rate (SAR)** is a measure of the infectivity or communicability of an infectious disease within a specific group (usually a household). It represents the number of exposed individuals who develop the disease within the incubation period following exposure to a primary case. **Pertussis (Whooping Cough)**, caused by *Bordetella pertussis*, is one of the most highly contagious vaccine-preventable diseases. In unimmunized household settings, where exposure is intense and prolonged, the SAR is consistently reported to be between **80% and 90%**. This high rate is due to the efficient aerosolized droplet transmission and the high susceptibility of non-immune individuals. **2. Why the Incorrect Options are Wrong** * **A (30%) & B (40%):** These rates are too low for Pertussis. Such figures might be seen in diseases with lower infectivity or in populations with high levels of partial immunity (e.g., older children with waning vaccine immunity). * **C (60%):** While 60% represents a high degree of contagion (similar to Mumps or Rubella), it still underestimates the extreme transmissibility of Pertussis in a completely susceptible household. **3. High-Yield Clinical Pearls for NEET-PG** * **SAR of Measles:** Also approximately **90%** (often cited as the most contagious viral disease). * **SAR of Chickenpox:** Approximately **70–80%**. * **Formula for SAR:** (Number of exposed persons developing the disease within incubation period / Total number of exposed susceptible contacts) × 100. * **Denominator Note:** The primary case is always excluded from both the numerator and the denominator when calculating SAR. * **Public Health Utility:** SAR is used to evaluate the effectiveness of prophylactic measures (like post-exposure antibiotics) and to trace the spread of an epidemic.
Explanation: ### Explanation **1. Why Option B is Correct:** A **Case-Control Study** is fundamentally a **retrospective study** because it starts with the effect (disease) and looks backward in time to identify the cause (exposure). In this design, researchers identify individuals with a specific condition (**Cases**) and compare them to individuals without the condition (**Controls**). By reviewing medical records or conducting interviews, they determine the frequency of exposure to a suspected risk factor in both groups. Because the direction of inquiry is "backward" from outcome to exposure, it is classified as retrospective. **2. Why Other Options are Incorrect:** * **Option A (Prospective study):** These studies (like Cohort studies) start with a group of exposed and non-exposed individuals and follow them forward in time to see who develops the disease. * **Option C (Cross-sectional study):** These are "snapshot" studies that measure exposure and outcome simultaneously at a single point in time. They cannot establish a temporal relationship (which came first). **3. NEET-PG High-Yield Clinical Pearls:** * **Measure of Association:** The **Odds Ratio (OR)** is the key statistic derived from Case-Control studies. (Remember: *C*ase-Control = *O*dds Ratio). * **Suitability:** This is the best study design for **rare diseases** (e.g., specific cancers) because you start with the cases already diagnosed. * **Bias:** These studies are highly prone to **Recall Bias** (patients with the disease are more likely to remember past exposures than healthy controls) and **Selection Bias**. * **Matching:** This technique is used in case-control studies to eliminate the effects of confounding variables.
Explanation: ***Both Sensitivity and Specificity increase*** - When the **ROC curve** shifts from blue to red (higher **AUC**), the diagnostic test becomes inherently better at discriminating between disease and non-disease states. - This represents an **improvement in test performance** where both true positive rate (**sensitivity**) and true negative rate (**specificity**) increase simultaneously across all threshold values. *Both Sensitivity and Specificity decrease* - This would occur if the ROC curve moved closer to the **diagonal line of no discrimination** (AUC approaching 0.5). - A curve shift from blue to red represents **improved performance**, not deterioration of both metrics. *Sensitivity increases and Specificity decreases* - This describes moving the **cut-off point** along a single ROC curve toward the upper-right, trading specificity for sensitivity. - The question shows a **curve shift** (different test performance), not a threshold adjustment on the same curve. *Sensitivity decreases and Specificity increases* - This describes moving the **cut-off point** along a single ROC curve toward the lower-left, trading sensitivity for specificity. - Again, this represents **threshold adjustment** rather than the fundamental improvement in test discrimination shown by the curve shift.
Explanation: ### Explanation **1. Why Option B is Correct:** Primary prevention aims to prevent the onset of disease by intervening before the disease process begins. In the natural history of disease, this occurs during the **pre-pathogenesis phase**. At this stage, the interaction between the agent, host, and environment has not yet resulted in pathological changes. The goal is to reduce the incidence of disease through two main modes of intervention: **Health Promotion** (e.g., nutrition, health education) and **Specific Protection** (e.g., immunization, chemoprophylaxis). **2. Analysis of Incorrect Options:** * **Option A (Primordial Prevention):** This refers to preventing the *emergence* of risk factors in populations where they have not yet appeared (e.g., discouraging children from starting smoking). Primary prevention, conversely, acts when risk factors are already present but the disease is not. * **Option C (Secondary Prevention):** Prevention in the "incipient" or early stage of disease refers to **Secondary Prevention**. This occurs during the early pathogenesis phase, focusing on early diagnosis and prompt treatment to arrest the disease process. * **Option D (Tertiary Prevention):** This occurs in the late pathogenesis phase. It focuses on **disability limitation** and **rehabilitation** to reduce the impact of long-term disease and improve quality of life. **3. NEET-PG High-Yield Pearls:** * **Primary Prevention = Incidence reduction.** * **Secondary Prevention = Prevalence reduction** (by shortening disease duration). * **Vaccination** is the most classic example of Primary Prevention (Specific Protection). * **Pap smears and Sputum AFB** are examples of Secondary Prevention (Early diagnosis). * **Concept Check:** If a question mentions "action taken *prior* to the onset of disease," always think **Primary**. If it mentions "action taken *after* the disease has started but before it is symptomatic," think **Secondary**.
Explanation: ### Explanation The correct answer is **C. Both incidence and duration of the disease.** #### Underlying Medical Concept Prevalence refers to the total number of all individuals who have a particular disease in a population at a specific point in time (Point Prevalence) or over a period (Period Prevalence). It is a measure of the **burden of disease**. The relationship between Prevalence (P), Incidence (I), and average Duration (D) of a disease is expressed by the mathematical formula: **P = I × D** * **Incidence (I):** Represents the number of *new* cases. If more people develop the disease, the total pool of cases (prevalence) increases. * **Duration (D):** Represents how long a person stays "a case" before recovery or death. If a disease is chronic (long duration), the prevalence will be high even if the incidence is low. #### Analysis of Options * **Option A (Incidence):** While incidence affects prevalence, it is not the *only* factor. A high incidence with a very short duration (e.g., a rapidly fatal disease or a quick recovery) will result in low prevalence. * **Option B (Duration):** Similarly, duration alone does not determine prevalence. Without new cases (incidence) entering the pool, prevalence would eventually drop to zero. * **Option D:** Incorrect, as both A and B are established determinants. #### NEET-PG High-Yield Pearls * **Prevalence is a Ratio, not a Rate:** Unlike incidence (which is a rate), prevalence is technically a proportion. * **Factors increasing Prevalence:** Immigration of cases, prolongation of life without a cure, and increase in incidence. * **Factors decreasing Prevalence:** High fatality rate (short duration), improved cure rates, and emigration of cases. * **Application:** Prevalence is most useful for **administrative purposes** and planning health services (e.g., hospital beds for chronic diseases like Diabetes). Incidence is better for studying **etiology/causation**.
Principles of Epidemiology
Practice Questions
Measures of Disease Frequency
Practice Questions
Epidemiological Study Designs
Practice Questions
Descriptive Epidemiology
Practice Questions
Analytical Epidemiology
Practice Questions
Experimental Epidemiology
Practice Questions
Screening for Disease
Practice Questions
Surveillance Systems
Practice Questions
Investigation of an Epidemic
Practice Questions
Association and Causation
Practice Questions
Modern Epidemiological Methods
Practice Questions
Critical Appraisal of Epidemiological Studies
Practice Questions
Get full access to all questions, explanations, and performance tracking.
Start For Free