
Epidemiology — MCQs

On this page
Define net reproduction rate
In a study, 100 patients were telephoned and asked whether they exercise daily (exposure), and whether they have coronary artery disease now or ever before (outcome). Identify the study design.
In a contraceptive study, 500 women were followed for 6 months. During this period, 4 pregnancies occurred. What is the Pearl Index?
A health centre conducts screening of women in the community. An elderly woman is detected to have carcinoma of the cervix/breast during this screening. This activity corresponds to which level of prevention?
On evaluating an influenza vaccine, it demonstrated an efficacy of 95% in randomized controlled trials and an effectiveness of 90% in post-marketing surveillance studies. Which of the following statement is incorrect?
On investigating an outbreak, an epidemiologist plots epidemic curve of acute febrile illness showing successive clusters separated by approximately 1 incubation period apart. Which of the following diseases shows this pattern of propagated spread?
In a defined population, approximately 67% of all stroke cases are attributable to uncontrolled hypertension. If hypertension were adequately managed, 2/3rd of stroke burden could be eliminated. This is an example of:
Health data from 15 nations investigates the relationship between per capita tobacco consumption and national COPD prevalence, revealing a strong positive correlation. Which study type best describes this?
Assertion: In a nested case-control study, incidence rates can be derived from the parent cohort. Reason: Nested case-control studies have the ability to estimate relative risk accurately.
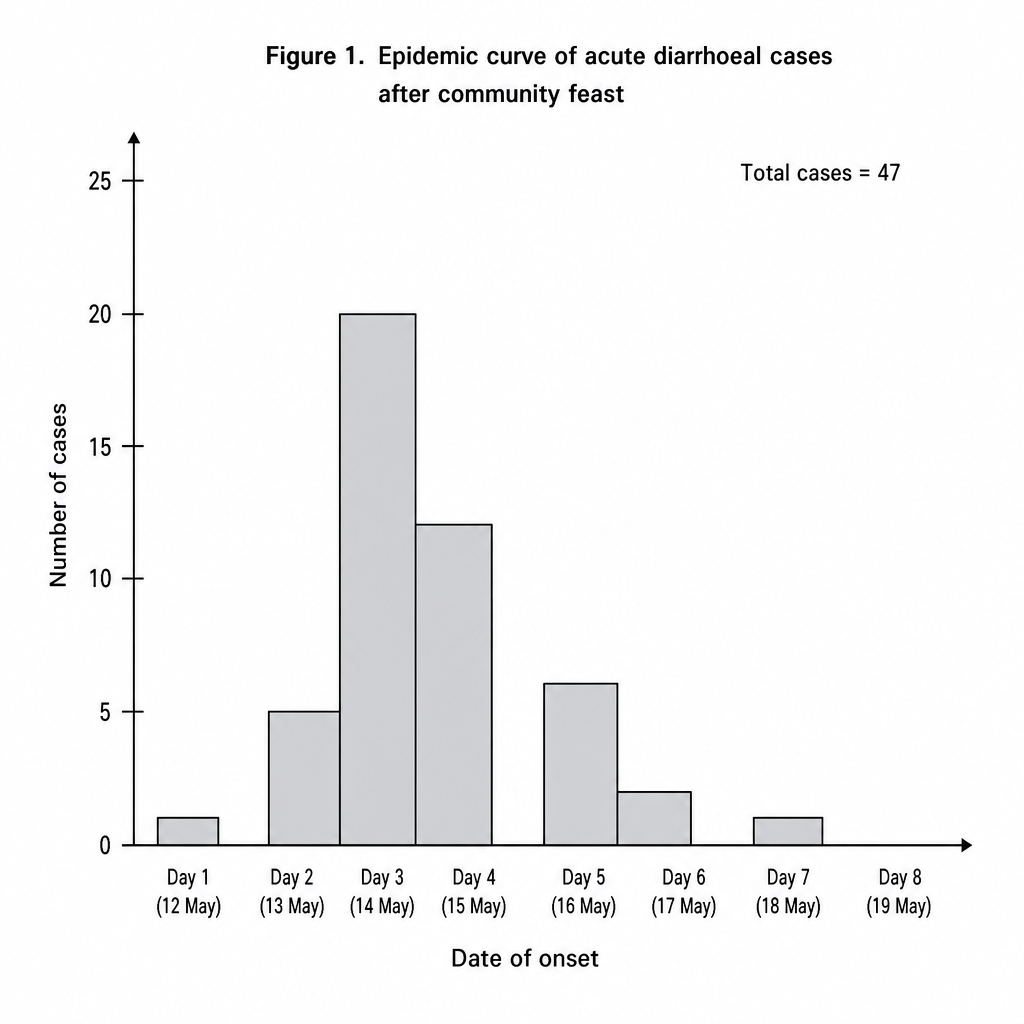
Following a community feast in a rural village in Rajasthan, the district health officer receives reports of 47 individuals presenting with acute watery diarrhoea, nausea, and vomiting within a 72-hour window. The officer plots the onset dates of all confirmed cases. The epidemic curve (Figure 1) shows a sharp single peak on day 3 followed by rapid decline, with no secondary waves. Based on Figure 1, which of the following conclusions is most appropriate to guide the investigation?
Practice by Chapter
Principles of Epidemiology
Practice Questions
Measures of Disease Frequency
Practice Questions
Epidemiological Study Designs
Practice Questions
Descriptive Epidemiology
Practice Questions
Analytical Epidemiology
Practice Questions
Experimental Epidemiology
Practice Questions
Screening for Disease
Practice Questions
Surveillance Systems
Practice Questions
Investigation of an Epidemic
Practice Questions
Association and Causation
Practice Questions
Modern Epidemiological Methods
Practice Questions
Critical Appraisal of Epidemiological Studies
Practice Questions
Want unlimited practice?
Get full access to all questions, explanations, and performance tracking.
Scan to download app