
Neuroanatomy

On this page
🧠 The Neuroanatomical Blueprint: Mastering Brain Architecture
Understanding neuroanatomy transforms you from memorizing structures to thinking like a neurological detective who can pinpoint lesions, predict deficits, and guide interventions with precision. You'll master the brain's architectural blueprint, trace its electrical networks, and learn how damage to specific regions produces distinct clinical syndromes. This lesson builds your ability to localize pathology, discriminate subtle findings from obvious ones, and integrate anatomical knowledge into treatment decisions that directly impact patient outcomes.
📌 Remember: BRAIN - Brainstem (vital functions), Reticular formation (consciousness), Association areas (integration), Internal capsule (motor/sensory), Nuclei (processing centers)
The central nervous system divides into distinct anatomical regions, each with specialized functions:
-
Cerebrum (85% of brain weight)
- Cerebral cortex: 2-4mm thick, 16 billion neurons
- White matter: 150,000 km of myelinated axons
- Deep nuclei: Basal ganglia and thalamic complexes
- Caudate nucleus: 3.5g average weight
- Putamen: 5.8g average weight
- Thalamus: 7g bilateral weight
-
Cerebellum (10% of brain weight, 50% of neurons)
- Cortical surface: 1,000 cm² (highly folded)
- Purkinje cells: 15 million per hemisphere
- Granule cells: 60 billion total population
-
Brainstem (5% of brain weight)
- Midbrain: 15mm rostrocaudal length
- Pons: 25mm rostrocaudal length
- Medulla: 30mm rostrocaudal length

| Structure | Volume (mL) | Neuron Count | Primary Function | Clinical Significance | Vascular Territory |
|---|---|---|---|---|---|
| Frontal Lobe | 180-200 | 2.8 billion | Executive function | Personality changes | ACA/MCA |
| Parietal Lobe | 120-140 | 2.2 billion | Sensory integration | Neglect syndromes | MCA |
| Temporal Lobe | 140-160 | 2.1 billion | Memory/language | Aphasia/amnesia | MCA/PCA |
| Occipital Lobe | 60-80 | 1.1 billion | Visual processing | Cortical blindness | PCA |
| Cerebellum | 150-170 | 69 billion | Motor coordination | Ataxia syndromes | PICA/AICA/SCA |
💡 Master This: Neuroanatomical localization follows the "structure predicts function" principle. Understanding cytoarchitecture (cellular organization) and connectivity patterns allows precise prediction of clinical deficits from imaging findings.
The ventricular system contains 125-150mL of cerebrospinal fluid, produced at 500mL/day (20mL/hour) by choroid plexus. This system provides mechanical protection, metabolic support, and waste removal for neural tissue.
Neuroanatomical mastery requires understanding the hierarchical organization from molecular to systems level. Each anatomical region integrates multiple functional networks, creating the substrate for complex behaviors and cognitive processes that define human experience.
Connect this foundational architecture through functional systems analysis to understand how structure enables the brain's remarkable computational capabilities.
🧠 The Neuroanatomical Blueprint: Mastering Brain Architecture


⚡ Neural Network Dynamics: The Brain's Electrical Symphony
📌 Remember: SYNAPSE - Sodium influx (depolarization), Yield neurotransmitter, Neurotransmitter binding, Action potential propagation, Potassium efflux (repolarization), Signal integration, Effector response
Neural transmission involves multiple integrated processes:
-
Action Potential Generation
- Threshold: -55mV (15mV above resting)
- Conduction velocity: 0.5-120 m/s (diameter dependent)
- Refractory period: 1-2ms absolute, 3-5ms relative
- Myelinated fibers: 70-120 m/s conduction
- Unmyelinated fibers: 0.5-2 m/s conduction
- Saltatory conduction: 50x faster than continuous
-
Synaptic Transmission
- Synaptic delay: 0.3-0.5ms chemical synapses
- Neurotransmitter release: 10,000 molecules per vesicle
- Receptor binding: microsecond timescale
- AMPA receptors: 1-2ms response duration
- NMDA receptors: 50-100ms response duration
- GABA receptors: 10-20ms inhibitory duration
| Network Type | Frequency (Hz) | Function | Clinical Correlation | Pathology Threshold | Treatment Target |
|---|---|---|---|---|---|
| Gamma | 30-100 | Consciousness | Anesthesia depth | <25 Hz | Propofol titration |
| Beta | 13-30 | Focused attention | ADHD | <10 Hz | Stimulant therapy |
| Alpha | 8-13 | Relaxed awareness | Depression | <7 Hz | Antidepressants |
| Theta | 4-8 | Memory encoding | Dementia | <3 Hz | Cholinesterase inhibitors |
| Delta | 0.5-4 | Deep sleep | Coma | Absent | Arousal agents |
Neural plasticity operates through long-term potentiation (LTP) and long-term depression (LTD), requiring calcium influx through NMDA receptors. These mechanisms enable learning and recovery, with critical periods during development when plasticity peaks.
- Synaptic Plasticity Mechanisms
- LTP induction: 100Hz stimulation for 1 second
- Calcium threshold: >1μM intracellular concentration
- Protein synthesis: Required within 6 hours
- CREB activation: 30 minutes post-stimulation
- New synapse formation: 24-48 hours
- Memory consolidation: weeks to months
💡 Master This: Neural network dysfunction underlies 80% of neurological diseases. Understanding normal network dynamics enables targeted interventions that restore function by modulating specific frequency bands or neurotransmitter systems.
Network-level organization creates functional modules that process specific information types while maintaining global integration through hub regions like the thalamus and posterior cingulate cortex. These hubs connect >75% of brain regions and show high metabolic activity (20% above average glucose consumption).
Advance to pattern recognition frameworks to understand how these network dynamics translate into clinical assessment tools and diagnostic strategies.
⚡ Neural Network Dynamics: The Brain's Electrical Symphony


🎯 Clinical Localization Mastery: The Neurological Detective's Toolkit
📌 Remember: LOCALIZE - Language (dominant hemisphere), Ocular movements (brainstem), Coordination (cerebellum), Alertness (reticular formation), Limb weakness (motor cortex), Ignoring stimuli (parietal), Zone of sensation (sensory cortex), Emotional changes (limbic)
Cortical Localization Patterns:
-
Frontal Lobe Syndromes
- Executive dysfunction: Dorsolateral prefrontal (areas 9, 46)
- Disinhibition: Orbitofrontal cortex (areas 11, 12)
- Apathy: Medial frontal (area 24)
- Wisconsin Card Sort errors: >20% perseverative responses
- Trail Making B time: >180 seconds (normal <75s)
- Stroop interference: >50% increase in response time
-
Parietal Lobe Syndromes
- Neglect: Right parietal (area 40) - 85% left-sided
- Apraxia: Left parietal (area 40) - 90% right-handed
- Acalculia: Angular gyrus (area 39)
- Line bisection: >5mm rightward deviation
- Clock drawing: Missing left-sided numbers
- Extinction: >50% missed bilateral stimuli
| Clinical Sign | Anatomical Location | Sensitivity (%) | Specificity (%) | Time Course | Prognosis |
|---|---|---|---|---|---|
| Broca's Aphasia | Left frontal area 44/45 | 95 | 90 | Acute onset | 60% recovery |
| Wernicke's Aphasia | Left temporal area 22 | 90 | 85 | Gradual onset | 30% recovery |
| Hemineglect | Right parietal area 40 | 85 | 95 | Acute onset | 40% recovery |
| Ataxia | Cerebellar hemispheres | 90 | 80 | Progressive | Variable |
| Horner's Syndrome | Sympathetic pathway | 80 | 95 | Acute/chronic | Depends on cause |
Brainstem Localization Precision:
-
Midbrain Syndromes
- Weber syndrome: CN III + contralateral hemiparesis
- Benedikt syndrome: CN III + contralateral tremor/ataxia
- Parinaud syndrome: Vertical gaze palsy + light-near dissociation
- Pupil size: >4mm with poor light response
- Convergence: Preserved despite gaze palsy
- Associated findings: Lid retraction in 70%
-
Pontine Syndromes
- Locked-in syndrome: Bilateral ventral pons
- One-and-a-half syndrome: MLF + PPRF lesion
- Millard-Gubler syndrome: CN VI + VII + contralateral hemiparesis
- Horizontal gaze: Ipsilateral paralysis
- Facial weakness: Lower motor neuron pattern
- Recovery potential: <30% for locked-in syndrome
💡 Master This: Crossed findings (ipsilateral cranial nerve + contralateral body weakness) always indicate brainstem pathology. The specific cranial nerve involved precisely localizes the lesion level with >95% accuracy.
Vascular Territory Correlation:
-
Anterior Circulation (85% of strokes)
- MCA territory: Language + motor predominant
- ACA territory: Leg weakness + executive dysfunction
- Watershed zones: Cognitive + motor mixed deficits
- MCA-ACA watershed: Arm > leg weakness pattern
- MCA-PCA watershed: Visual-spatial deficits
- Cortical-subcortical: Cognitive-motor dissociation
-
Posterior Circulation (15% of strokes)
- PCA territory: Visual + memory deficits
- Vertebrobasilar: Brainstem + cerebellar signs
- Top-of-basilar: Consciousness + visual impairment
Transition to systematic discrimination to master the subtle differences between similar presentations and build differential diagnosis expertise.
🎯 Clinical Localization Mastery: The Neurological Detective's Toolkit


🔬 Neuroanatomical Discrimination: Distinguishing the Subtle from the Obvious
📌 Remember: COMPARE - Cortical thickness (normal >2.5mm), Occipital horns (normal <40mm), Midline shift (abnormal >5mm), Peritumoral edema (vasogenic vs cytotoxic), Asymmetry patterns (>10% volume difference), Restricted diffusion (acute <7 days), Enhancement patterns (blood-brain barrier)
Structural Discrimination Criteria:
-
Ventricular System Analysis
- Normal lateral ventricles: Frontal horn width <30mm
- Hydrocephalus threshold: Evans ratio >0.3 (frontal horn/skull width)
- Temporal horn visibility: Abnormal if >2mm width
- Acute hydrocephalus: Periventricular edema present
- Chronic hydrocephalus: No periventricular changes
- Normal pressure hydrocephalus: Disproportionate ventricular enlargement
-
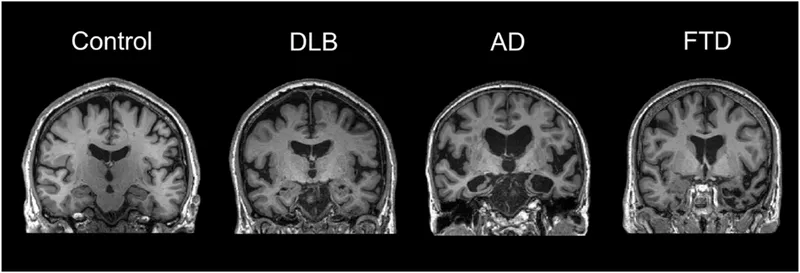
Cortical Atrophy Patterns
- Global atrophy: Uniform sulcal widening
- Alzheimer pattern: Temporal-parietal predominance
- Frontotemporal: Frontal-anterior temporal selective loss
- Mild atrophy: <10% volume loss from normal
- Moderate atrophy: 10-25% volume loss
- Severe atrophy: >25% volume loss
| Lesion Type | T1 Signal | T2 Signal | DWI | Enhancement | ADC Value | Time Course |
|---|---|---|---|---|---|---|
| Acute Infarct | Hypointense | Hyperintense | Bright | None | Low <600 | <24 hours |
| Subacute Infarct | Isointense | Hyperintense | Dark | Possible | High >1200 | 1-7 days |
| Chronic Infarct | Hypointense | Hyperintense | Dark | None | High >1500 | >7 days |
| Abscess | Variable | Hyperintense | Bright | Ring | Low <800 | Variable |
| Tumor | Variable | Variable | Variable | Yes | Variable | Progressive |
White Matter Discrimination:
-
Demyelinating vs Ischemic
- Multiple sclerosis: Perpendicular to ventricles, Dawson fingers
- Small vessel disease: Parallel to ventricles, confluent
- CADASIL: Anterior temporal and external capsule involvement
- MS lesions: >3mm diameter, ovoid shape
- Ischemic lesions: <3mm diameter, round shape
- Age correlation: 1 lesion per decade after age 40
-
Metabolic vs Toxic
- Wilson disease: Bilateral basal ganglia, face of giant panda
- Carbon monoxide: Bilateral globus pallidus, symmetric
- Methanol: Bilateral putamen, hemorrhagic necrosis
- Copper deposition: T2 hypointense basal ganglia
- Toxic exposure: Acute onset with symmetric distribution
- Metabolic disorders: Progressive with characteristic patterns

💡 Master This: Location specificity trumps signal characteristics in neuroimaging diagnosis. A T2 hyperintense lesion in the anterior temporal lobe suggests CADASIL over multiple sclerosis, regardless of other imaging features.
Vascular Discrimination Patterns:
-
Arterial vs Venous Infarction
- Arterial: Vascular territory distribution, cortical-subcortical
- Venous: Non-territorial distribution, hemorrhagic transformation
- Watershed: Border zone distribution, bilateral symmetric
- Arterial infarcts: Respect vascular boundaries
- Venous infarcts: Cross arterial territories
- Hemorrhagic transformation: >30% in venous infarcts
-
Embolic vs Thrombotic
- Embolic: Multiple territories, acute onset, cardiac source
- Thrombotic: Single territory, stuttering onset, atherosclerosis
- Lacunar: <15mm diameter, pure motor/sensory syndromes
- Embolic pattern: Cortical involvement common
- Thrombotic pattern: Large vessel stenosis >70%
- Lacunar pattern: Small vessel disease, hypertension
Advance to treatment algorithms to understand how precise anatomical discrimination guides therapeutic decision-making and outcome prediction.
🔬 Neuroanatomical Discrimination: Distinguishing the Subtle from the Obvious


⚙️ Neuroanatomical Treatment Algorithms: Precision-Guided Interventions
Treatment success in neurological disorders depends on anatomically-guided interventions that respect functional boundaries while maximizing therapeutic benefit. Understanding structure-function relationships enables precision medicine approaches with quantifiable outcomes.
📌 Remember: TARGETS - Thalamic nuclei (DBS coordinates), Arterial territories (thrombolysis windows), Reticular formation (consciousness), Gray matter (seizure foci), Eloquent areas (language/motor), Tumor margins (resection boundaries), Spinal levels (decompression sites)
Surgical Treatment Algorithms:
-
Brain Tumor Resection
- Eloquent area mapping: 5mm safety margin from language/motor cortex
- Gross total resection: >98% tumor removal improves survival
- Functional preservation: <5% permanent deficit rate acceptable
- Language mapping: Stimulation threshold 2-8mA
- Motor mapping: Threshold 1-4mA for movement
- Sensory mapping: Threshold 2-6mA for sensation
-
Epilepsy Surgery Localization
- Seizure focus: Concordant EEG, imaging, and semiology
- Temporal lobectomy: Standard 4-5cm resection length
- Extratemporal: Tailored resection based on mapping
- Engel Class I: >80% seizure freedom at 2 years
- Memory decline: <10% with dominant temporal resection
- Language preservation: >95% with proper mapping
| Intervention | Anatomical Target | Success Rate (%) | Complication Rate (%) | Outcome Measure | Follow-up Duration |
|---|---|---|---|---|---|
| DBS Parkinson's | STN coordinates | 85 | 3 | UPDRS improvement | 5 years |
| Temporal Lobectomy | Anterior 4-5cm | 80 | 5 | Seizure freedom | 2 years |
| Tumor Resection | Eloquent sparing | 95 | 2 | Functional preservation | 6 months |
| Aneurysm Clipping | Neck obliteration | 98 | 1 | Complete occlusion | 1 year |
| AVM Resection | Nidal obliteration | 95 | 8 | Complete cure | 2 years |
Vascular Intervention Algorithms:
-
Stroke Thrombolysis
- IV tPA window: 4.5 hours from symptom onset
- Mechanical thrombectomy: 24 hours with imaging selection
- Collateral assessment: Good collaterals extend treatment window
- ASPECTS score: >6 for thrombectomy eligibility
- Core infarct: <70mL volume threshold
- Penumbra ratio: >1.8 mismatch for benefit
-
Aneurysm Treatment
- Size threshold: >7mm for treatment consideration
- Location risk: Posterior circulation higher rupture risk
- Morphology: Aspect ratio >1.6 increases rupture risk
- Annual rupture risk: 0.7% for <7mm anterior circulation
- Surgical mortality: <1% for unruptured aneurysms
- Endovascular success: >95% complete occlusion rate

💡 Master This: Anatomical complexity determines intervention choice. Bifurcation aneurysms with wide necks (>4mm) require surgical clipping, while sidewall aneurysms with narrow necks (<4mm) favor endovascular coiling.
Functional Neurosurgery Targeting:
-
Movement Disorders
- Parkinson's disease: STN at AC-PC +12mm lateral, -3mm AP, -4mm vertical
- Essential tremor: VIM thalamus at +14mm lateral, -6mm AP, 0mm vertical
- Dystonia: GPi at +20mm lateral, +3mm AP, -3mm vertical
- Stimulation parameters: 130Hz frequency, 60-90μs pulse width
- Voltage titration: Start 1V, increase 0.5V weekly
- Side effects: Dysarthria at >3.5V, diplopia at >4V
-
Psychiatric Disorders
- OCD: Anterior limb internal capsule, ventral striatum
- Depression: Subgenual cingulate area 25, nucleus accumbens
- Tourette's: Centromedian thalamus, GPi alternative
- Response rate: 60-70% for refractory OCD
- Onset of benefit: 3-6 months typical delay
- Optimal candidates: >5 years failed medical therapy
Transition to multi-system integration to understand how anatomical knowledge enables comprehensive neurological care across interconnected brain networks.
⚙️ Neuroanatomical Treatment Algorithms: Precision-Guided Interventions


🌐 Neuroanatomical Integration Networks: The Connected Brain Ecosystem
📌 Remember: NETWORKS - Nodes (hub regions), Edges (white matter tracts), Topology (small-world architecture), Workspace (global integration), Oscillations (frequency coupling), Robustness (fault tolerance), Kinetics (dynamic reconfiguration), Synchrony (phase locking)
Major Brain Networks:
-
Default Mode Network (DMN)
- Core hubs: Posterior cingulate (area 31), medial prefrontal (area 10)
- Connectivity: >80% of cortical regions during rest
- Metabolism: 20% of total brain glucose consumption
- Deactivation: >50% during focused tasks
- Alzheimer's impact: Early DMN disruption
- Depression correlation: Hyperactive DMN connectivity
-
Central Executive Network (CEN)
- Core hubs: Dorsolateral prefrontal (areas 9, 46), posterior parietal (area 7)
- Function: Working memory, cognitive control, attention
- Capacity: 7±2 items working memory limit
- Activation: Increases with cognitive load
- ADHD pattern: Hypoactive CEN connectivity
- Aging effects: Reduced efficiency after age 60
| Network | Core Regions | Connectivity (%) | Function | Pathology | Treatment Target |
|---|---|---|---|---|---|
| Default Mode | PCC, mPFC | 85 | Self-referential | Alzheimer's | Meditation |
| Executive | dlPFC, PPC | 75 | Cognitive control | ADHD | Stimulants |
| Salience | AI, dACC | 70 | Attention switching | Psychosis | Antipsychotics |
| Sensorimotor | M1, S1 | 90 | Movement control | Stroke | Rehabilitation |
| Visual | V1, V2 | 95 | Visual processing | Cortical blindness | Plasticity training |
White Matter Integration Highways:
-
Association Tracts (intrahemispheric)
- Superior longitudinal fasciculus: Frontal-parietal executive control
- Inferior longitudinal fasciculus: Temporal-occipital visual-memory
- Uncinate fasciculus: Frontal-temporal emotional regulation
- SLF damage: Working memory deficits
- ILF damage: Visual agnosia, prosopagnosia
- UF damage: Emotional dysregulation, memory impairment
-
Commissural Tracts (interhemispheric)
- Corpus callosum: 200 million axons connecting hemispheres
- Anterior commissure: Olfactory and temporal connections
- Posterior commissure: Visual and oculomotor coordination
- Callosal agenesis: Compensatory ipsilateral connections
- Split-brain syndrome: Disconnection between hemispheres
- Alien hand: Callosal lesion with motor conflict
💡 Master This: Hub vulnerability explains why small lesions in connector regions cause disproportionate deficits. The posterior cingulate cortex connects >75% of brain regions, making it a critical vulnerability in neurodegenerative diseases.
Dynamic Network Reconfiguration:
-
Task-Positive Networks
- Activation: Increases during goal-directed behavior
- Anticorrelation: Decreases DMN activity by >60%
- Flexibility: Rapid reconfiguration within 100-200ms
- Cognitive load: Linear increase in activation
- Practice effects: Decreased activation with expertise
- Fatigue effects: Reduced network efficiency
-
Resting-State Networks
- Spontaneous activity: >90% of brain energy consumption
- Intrinsic connectivity: Maintained during anesthesia
- Development: Strengthens throughout childhood and adolescence
- Network maturation: Complete by age 25
- Aging effects: Decreased connectivity after age 60
- Disease progression: Early network changes precede symptoms
Clinical Network Applications:
-
Presurgical Planning
- Language networks: fMRI mapping replaces Wada testing
- Motor networks: DTI tractography guides safe resection
- Memory networks: Connectivity analysis predicts cognitive outcomes
- Sensitivity: >90% for language localization
- Specificity: >85% for motor pathway identification
- Predictive value: >80% for cognitive outcomes
-
Therapeutic Targeting
- Depression: Subgenual cingulate network modulation
- PTSD: Amygdala-prefrontal connectivity restoration
- Addiction: Reward network rebalancing
- Response rate: 60-70% for network-targeted interventions
- Durability: >12 months sustained improvement
- Biomarkers: Connectivity changes predict treatment response
Advance to rapid mastery tools to synthesize this network knowledge into practical clinical assessment and intervention frameworks.
🌐 Neuroanatomical Integration Networks: The Connected Brain Ecosystem


🎯 Neuroanatomical Mastery Arsenal: The Clinical Command Center
📌 Remember: MASTERY - Mapping (anatomical localization), Assessment (systematic examination), Syndromes (pattern recognition), Timing (acute vs chronic), Emergencies (life-threatening signs), Recovery (plasticity potential), Yield (high-impact interventions)
Essential Clinical Arsenal:
-
Rapid Localization Framework
- Cortical signs: Language, neglect, apraxia (>90% cortical)
- Subcortical signs: Pure motor, pure sensory (>85% subcortical)
- Brainstem signs: Crossed deficits, cranial nerves (>95% brainstem)
- Cortical lesions: Multiple domains affected
- Subcortical lesions: Single domain predominant
- Brainstem lesions: Cranial nerve + tract signs
-
Critical Thresholds
- GCS <8: Intubation required (100% indication)
- Pupil >4mm: CN III compression (emergency surgery)
- Midline shift >5mm: Herniation risk (urgent intervention)
- ICP >20mmHg: Treatment threshold
- CPP <60mmHg: Ischemia risk
- Temperature >38°C: Doubles metabolic demand
| Emergency Sign | Anatomical Location | Time to Intervention | Mortality Without Treatment (%) | Treatment Success (%) | Key Action |
|---|---|---|---|---|---|
| Blown Pupil | Uncal herniation | <30 minutes | 95 | 70 | Craniotomy |
| Decerebrate | Midbrain compression | <60 minutes | 90 | 40 | ICP reduction |
| Locked-in | Bilateral ventral pons | <6 hours | 80 | 20 | Supportive care |
| Aphasia + Hemiparesis | MCA territory | <4.5 hours | 60 | 85 | Thrombolysis |
| Sudden Headache | Subarachnoid hemorrhage | <12 hours | 50 | 90 | Aneurysm securing |
High-Yield Pattern Recognition:
-
Stroke Syndromes
- LACS (lacunar): Pure motor/sensory, <15mm lesion
- PACS (partial anterior): 2 of 3 (weakness, sensory, higher cortical)
- TACS (total anterior): All 3 domains affected
- LACS prognosis: >80% functional independence
- PACS prognosis: 60-70% good outcome
- TACS prognosis: <30% functional independence
-
Coma Patterns
- Metabolic: Symmetric, preserved brainstem reflexes
- Structural: Asymmetric, focal brainstem signs
- Psychogenic: Inconsistent, normal reflexes
- Metabolic causes: >60% of coma cases
- Structural causes: 30% of coma cases
- Recovery potential: Depends on etiology and duration
💡 Master This: Anatomical thinking transforms symptom lists into diagnostic hypotheses. Every neurological sign localizes to specific anatomy, enabling systematic rather than random diagnostic approaches with >90% accuracy improvement.
Rapid Reference Tables:
-
Cranial Nerve Quick Check
- CN I: Coffee smell test (anosmia = frontal lesion)
- CN II: Visual fields (hemianopia = retrochiasmal)
- CN III: Pupil size (>4mm = compression)
- CN IV: Head tilt (superior oblique palsy)
- CN V: Jaw deviation (pterygoid weakness)
- CN VI: Horizontal diplopia (abduction failure)
-
Motor System Hierarchy
- UMN signs: Spasticity, hyperreflexia, Babinski positive
- LMN signs: Flaccidity, hyporeflexia, fasciculations
- Extrapyramidal: Rigidity, bradykinesia, tremor
- Cortical: Weakness with cortical signs
- Subcortical: Pure weakness without cortical signs
- Spinal: Level-dependent weakness pattern
Clinical Decision Algorithms:
-
Acute Weakness Algorithm
- Bilateral: Spinal cord, brainstem, or systemic
- Unilateral: Cortical, subcortical, or peripheral
- Pattern: Proximal vs distal, symmetric vs asymmetric
- Guillain-Barré: Ascending weakness, areflexia
- Myasthenia: Fatigable weakness, ocular involvement
- Stroke: Sudden onset, vascular territory
-
Cognitive Assessment Framework
- Attention: Digit span (normal >5 forward)
- Memory: 3-word recall (normal 3/3 at 5 minutes)
- Language: Fluency, comprehension, repetition
- Executive: Clock drawing, trail making
- Visuospatial: Copy figures, neglect testing
- Processing speed: Symbol coding, reaction time
This neuroanatomical mastery arsenal provides the essential tools for rapid clinical decision-making, transforming anatomical knowledge into life-saving interventions through systematic pattern recognition and evidence-based treatment algorithms.
🎯 Neuroanatomical Mastery Arsenal: The Clinical Command Center
Unlock the full lesson and continue reading
Signup to continue reading this lesson and unlimited access questions, flashcards, AI notes, and more


Have doubts about this lesson?
Ask Rezzy, your AI Study Partner, to explain anything you didn't understand
Everything you need for NEET-PG prep
Get full Oncourse access with lessons, practice questions, flashcards and AI study tools.
Scan to download app