
Biostatistics — MCQs

On this page
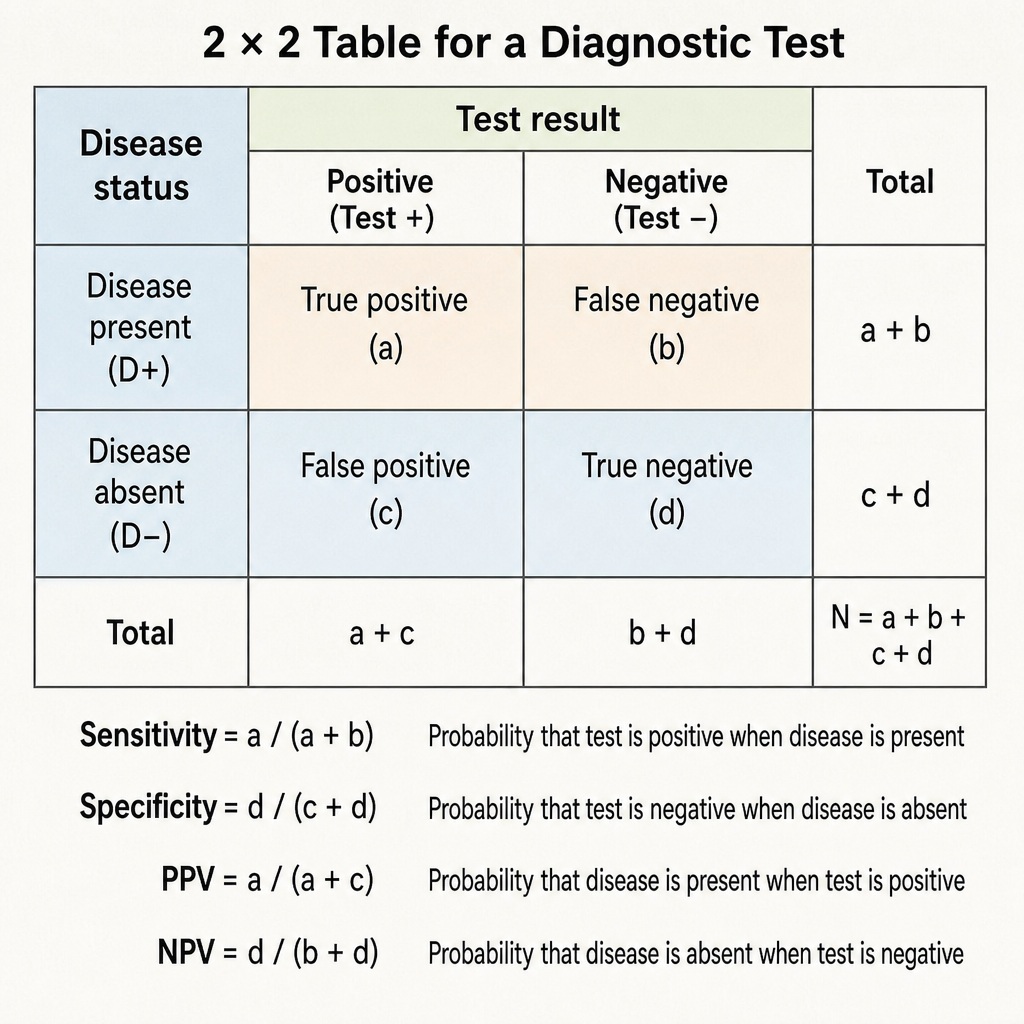
What does specificity in a diagnostic test measure?
Which of the following is a true statement regarding longitudinal studies?
Which of the following is not a method of random sampling?
After applying a statistical test, an investigator gets a p-value of 0.01. What does this indicate about the null hypothesis?
Which of the following statements about the normal distribution curve is true?
Which of the following is obtained by joining the midpoints of histogram blocks in statistics?
What is the definition of literacy according to census standards?
In the context of medical statistics, which graphical representation is used to show the proportion of different categories of a variable in a dataset?
Specificity of a diagnostic test is defined as:
Which of the following statements about screening tests is correct?
Practice by Chapter
Collection and Presentation of Data
Practice Questions
Measures of Central Tendency
Practice Questions
Measures of Dispersion
Practice Questions
Normal Distribution
Practice Questions
Sampling Methods
Practice Questions
Sample Size Calculation
Practice Questions
Hypothesis Testing
Practice Questions
Tests of Significance
Practice Questions
Correlation and Regression
Practice Questions
Survival Analysis
Practice Questions
Multivariate Analysis
Practice Questions
Statistical Software in Research
Practice Questions
Want unlimited practice?
Get full access to all questions, explanations, and performance tracking.
Scan to download app