
Biostatistics — MCQs

On this page
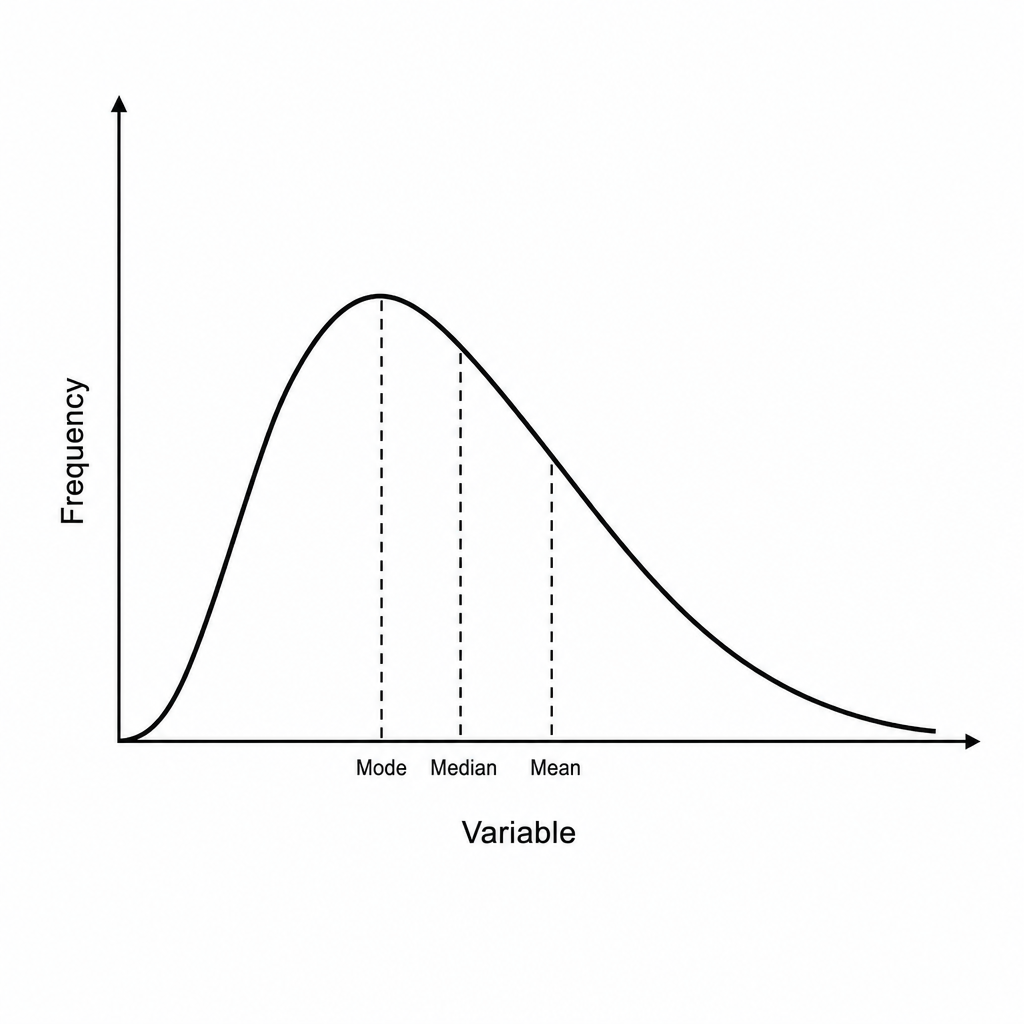
The figure below represents a statistical distribution. What type of skewness does it exhibit?
In a standard normal distribution curve, what percentage of the area under the curve lies between the mean and one standard deviation from the mean?
Case-control study is an example of?
Which type of chart is best to represent the following data? Year: 1991, 1992, 1993, 1994; Number of LBW babies: 125, 50, 25, 75.
What is the numerator in the formula for calculating Negative Predictive Value (NPV) in diagnostic testing?
Which of the following is an example of a case-control study that investigates the relationship between a risk factor and a disease?
In a study assessing malnutrition among young children, 100 children were selected from rural and urban areas (50 from each area). Out of these, 30 children from rural areas and 20 children from urban areas were found to be malnourished. Which statistical test is appropriate for comparing the proportions of malnourished children between the two groups?
In a study of 200 patients, CA-125 testing was performed. Among the 100 patients who tested positive, 60 had ovarian cancer confirmed by histopathology. Among the 100 patients who tested negative, 20 had ovarian cancer confirmed by histopathology. What is the negative predictive value of this test?
In a normal distribution with mean = 200 and standard deviation = 20, what is the range in which 68% of the values will fall?
Which type of study is used to determine the cross product ratio?
Practice by Chapter
Collection and Presentation of Data
Practice Questions
Measures of Central Tendency
Practice Questions
Measures of Dispersion
Practice Questions
Normal Distribution
Practice Questions
Sampling Methods
Practice Questions
Sample Size Calculation
Practice Questions
Hypothesis Testing
Practice Questions
Tests of Significance
Practice Questions
Correlation and Regression
Practice Questions
Survival Analysis
Practice Questions
Multivariate Analysis
Practice Questions
Statistical Software in Research
Practice Questions
Want unlimited practice?
Get full access to all questions, explanations, and performance tracking.
Scan to download app