
Biostatistics — MCQs

On this page
A researcher wants to study the relationship between smoking and lung cancer. She identifies 500 patients with lung cancer and 500 controls without lung cancer, then investigates their smoking history. What type of study design is this?
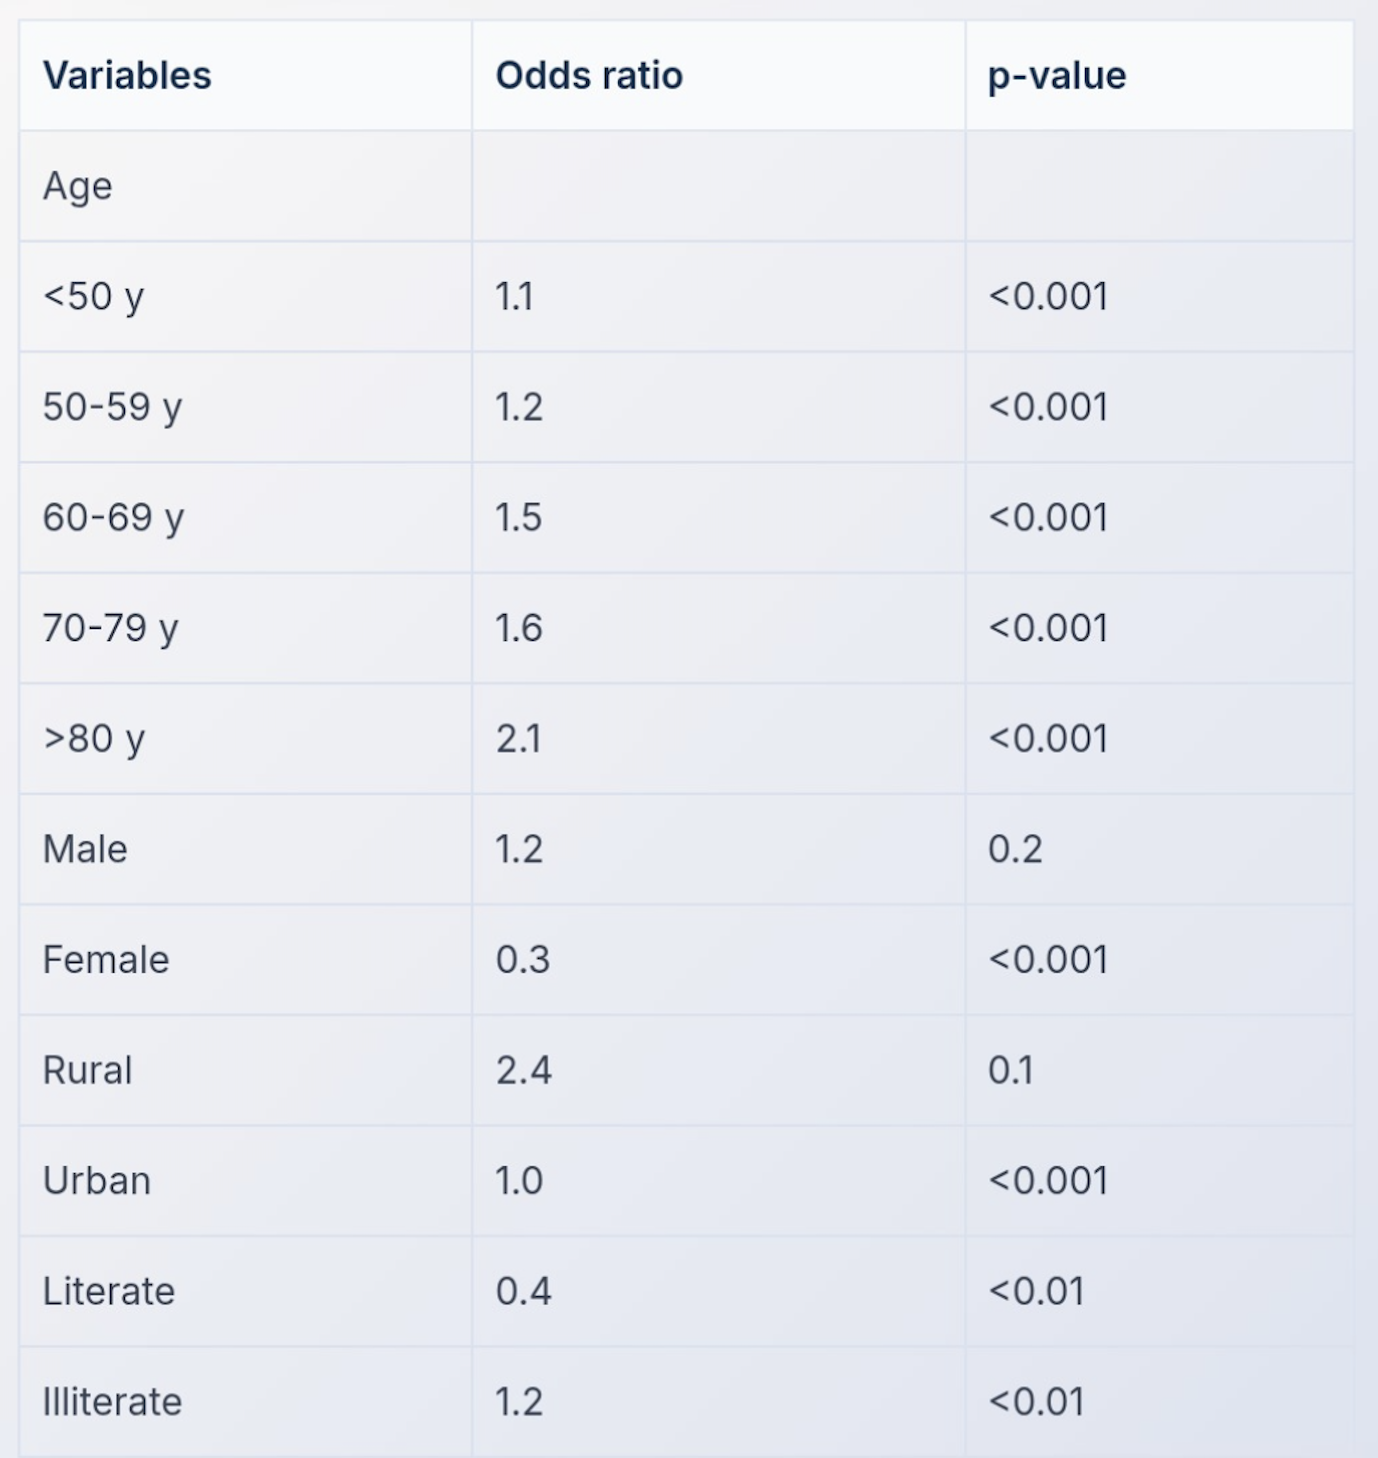
A multivariate analysis was conducted to examine the relationship between risk of developing blindness and age. The results are shown in the table below. Which of the following is true?
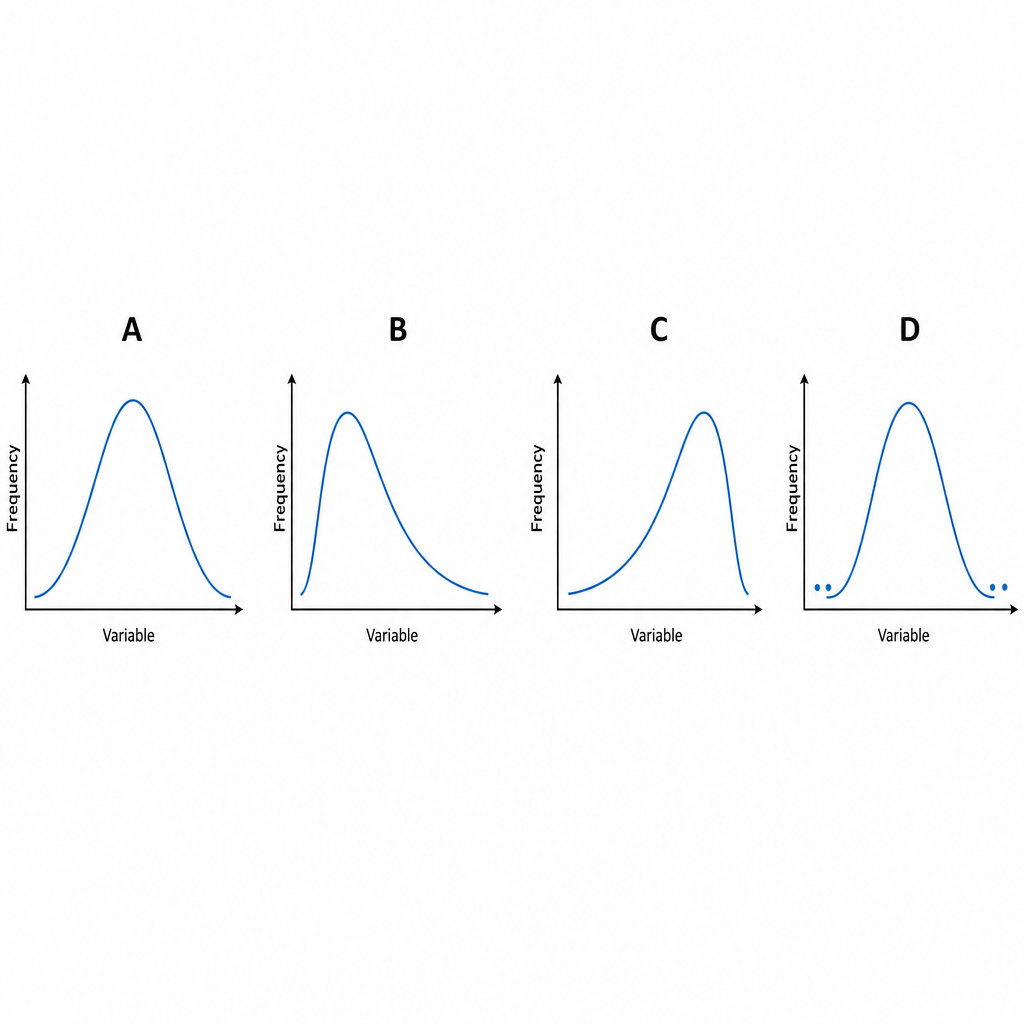
A graph shows four different distribution curves labeled A, B, C, and D. Identify the correct sequence of distribution types shown in the graph.
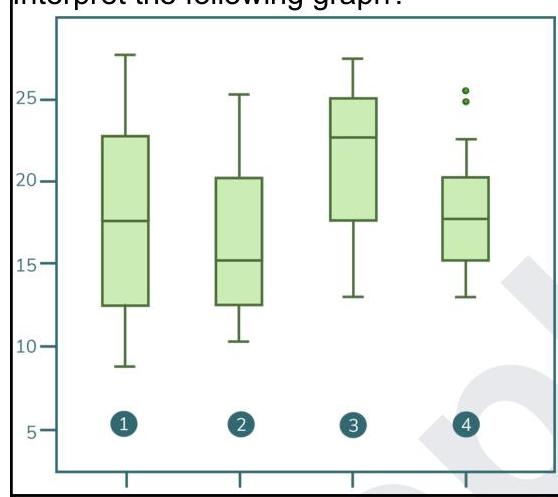
Interpret the following graph.
A study is performed to assess the intelligence quotient and the crime rate in a neighborhood. Students at a local high school are given an assessment and their criminal and disciplinary records are reviewed. One of the subjects scores 2 standard deviations over the mean. What percent of students did he score higher than?
The principal investigators of both studies recently met at a rheumatology conference. They both expressed an interest in combining data from their individual studies to be analyzed in a single study. A third researcher at the conference, who conducted her own project on the same topic recently, has also indicated she would like to contribute data to a pooled analysis. Which of the following statements regarding their new study design is true?
A researcher is studying whether a new knee implant is better than existing alternatives in terms of pain after knee replacement. She designs the study so that it includes all the surgeries performed at a certain hospital. Interestingly, she notices that patients who underwent surgeries on Mondays and Thursdays reported much better pain outcomes on a survey compared with those who underwent the same surgeries from the same surgeons on Tuesdays and Fridays. Upon performing further analysis, she discovers that one of the staff members who works on Mondays and Thursdays is aware of the study and tells all the patients about how wonderful the new implant is. Which of the following forms of bias does this most likely represent?
A rheumatologist is interested in studying the association between osteoporosis and the risk of sustaining a distal radius fracture. To explore this association, she develops a retrospective study design in which she identifies patients in a large institutional database over the age of 55 with and without osteoporosis, then follows them over a 10-year period to identify cases of distal radius fracture. She matches patients on age, sex, and body mass index to control for known confounding. After completing the study, she finds that patients with osteoporosis were at an increased risk of developing distal radius fractures. Which of the following study designs did this investigator use in this case?
A researcher is investigating whether there is an association between the use of social media in teenagers and bipolar disorder. In order to study this potential relationship, she collects data from people who have bipolar disorder and matched controls without the disorder. She then asks how much on average these individuals used social media in the 3 years prior to their diagnosis. This continuous data is divided into 2 groups: those who used more than 2 hours per day and those who used less than 2 hours per day. She finds that out of 1000 subjects, 500 had bipolar disorder of which 300 used social media more than 2 hours per day. She also finds that 400 subjects who did not have the disorder also did not use social media more than 2 hours per day. Which of the following is the odds ratio for development of bipolar disorder after being exposed to more social media?
Recently, clarithromycin was found to have an increased risk of cardiac death in a Danish study. This study analyzed patients who were previously treated with clarithromycin or another antibiotic, and then they were followed over time to ascertain if cardiac death resulted. What type of study design does this represent?
Practice by Chapter
Collection and Presentation of Data
Practice Questions
Measures of Central Tendency
Practice Questions
Measures of Dispersion
Practice Questions
Normal Distribution
Practice Questions
Sampling Methods
Practice Questions
Sample Size Calculation
Practice Questions
Hypothesis Testing
Practice Questions
Tests of Significance
Practice Questions
Correlation and Regression
Practice Questions
Survival Analysis
Practice Questions
Multivariate Analysis
Practice Questions
Statistical Software in Research
Practice Questions
Want unlimited practice?
Get full access to all questions, explanations, and performance tracking.
Scan to download app