
Biostatistics — MCQs

On this page
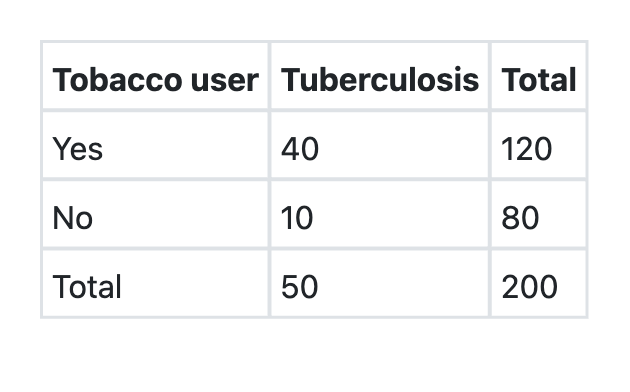
What is the relative risk of developing tuberculosis among tobacco users as per the information given below?
Which one of the following experiments/trials is a part of non-randomized trials?
Which one of the following statements regarding predictive value of a positive test is true?
A study was conducted to evaluate the effectiveness of a new antidiabetic drug. The fasting blood glucose levels (mg/dL) of 5 diabetic patients after 3 months of treatment were: 110, 94, 102, 98, 96. Consider the following statements about this data: 1. The range of blood glucose levels is 16 mg/dL 2. The median blood glucose level is 98 mg/dL 3. The standard deviation is √10 mg/dL
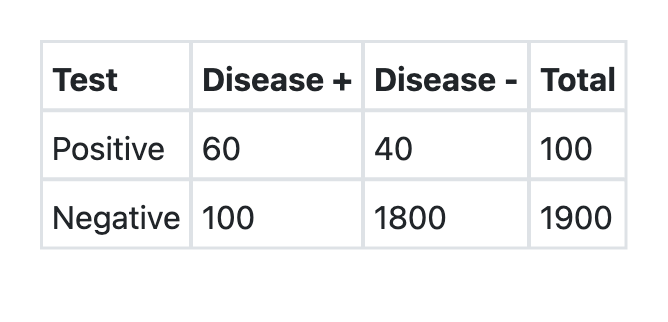
A new test was developed for detection of COVID-19. What is the sensitivity of the test as per the information provided above?
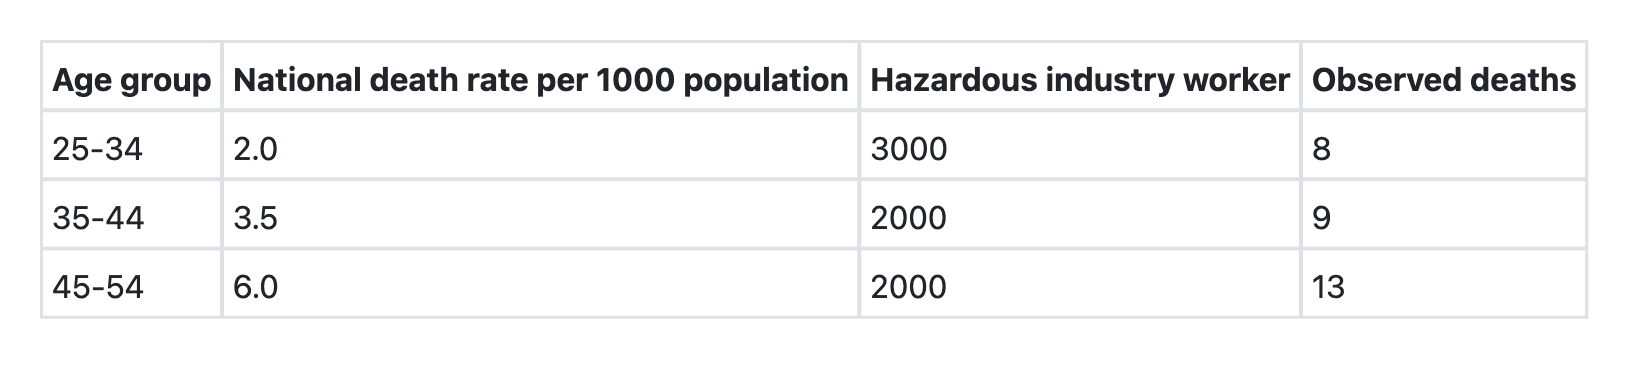
What is the Standardized Mortality Ratio (SMR) for the hazardous industry workers (as compared to national population)?
Consider the following: 1. Standard deviation 2. Range 3. Mode 4. Median Among the above, which is/are the measure/measures of dispersion?
With reference to historical cohort study, which of the following statements is not correct?
Specificity of a test is =
In a normal curve, the area between one standard deviation on either side of the mean will include:
Practice by Chapter
Collection and Presentation of Data
Practice Questions
Measures of Central Tendency
Practice Questions
Measures of Dispersion
Practice Questions
Normal Distribution
Practice Questions
Sampling Methods
Practice Questions
Sample Size Calculation
Practice Questions
Hypothesis Testing
Practice Questions
Tests of Significance
Practice Questions
Correlation and Regression
Practice Questions
Survival Analysis
Practice Questions
Multivariate Analysis
Practice Questions
Statistical Software in Research
Practice Questions
Want unlimited practice?
Get full access to all questions, explanations, and performance tracking.
Scan to download app