
Biostatistics — MCQs

On this page
The appropriate statistical test to find out obesity as a significant risk factor for breast cancer is:
Which of the following is/are the measure(s) of dispersion? 1. Mode 2. Median 3. Standard Deviation Select the correct answer using the code given below:
Analytical studies include the following methods of studies except:
Which one of the following is not a measure of dispersion?
The agreement (yes/no) between two observers is statistically measured by:
By which one of the following studies can relative risk be best calculated?
Which of the following types of study designs will be most appropriate to find out the association between mobile phone radiation exposure and cancer?
A cohort study was conducted among 200 men aged 20–30 years in Rampur village. Out of 200, 120 men were tobacco users and rest 80 didn’t take any form of tobacco. At the end of one year, 40 men among tobacco users and 10 men among non-tobacco users developed tuberculosis. The incidence of tuberculosis among tobacco users is:
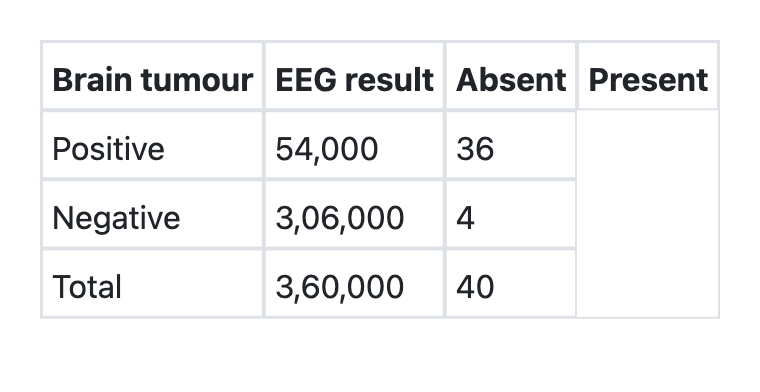
What is the sensitivity of EEG for detecting brain tumours as per the information given below?
What is the attributable risk percent (etiologic fraction) of tobacco for developing tuberculosis as per the information given below? Tobacco users Tuberculosis Total Present Absent Yes 40 80 120 No 10 70 80 Total 50 150 200
Practice by Chapter
Collection and Presentation of Data
Practice Questions
Measures of Central Tendency
Practice Questions
Measures of Dispersion
Practice Questions
Normal Distribution
Practice Questions
Sampling Methods
Practice Questions
Sample Size Calculation
Practice Questions
Hypothesis Testing
Practice Questions
Tests of Significance
Practice Questions
Correlation and Regression
Practice Questions
Survival Analysis
Practice Questions
Multivariate Analysis
Practice Questions
Statistical Software in Research
Practice Questions
Want unlimited practice?
Get full access to all questions, explanations, and performance tracking.
Scan to download app