
Biostatistics — MCQs

On this page
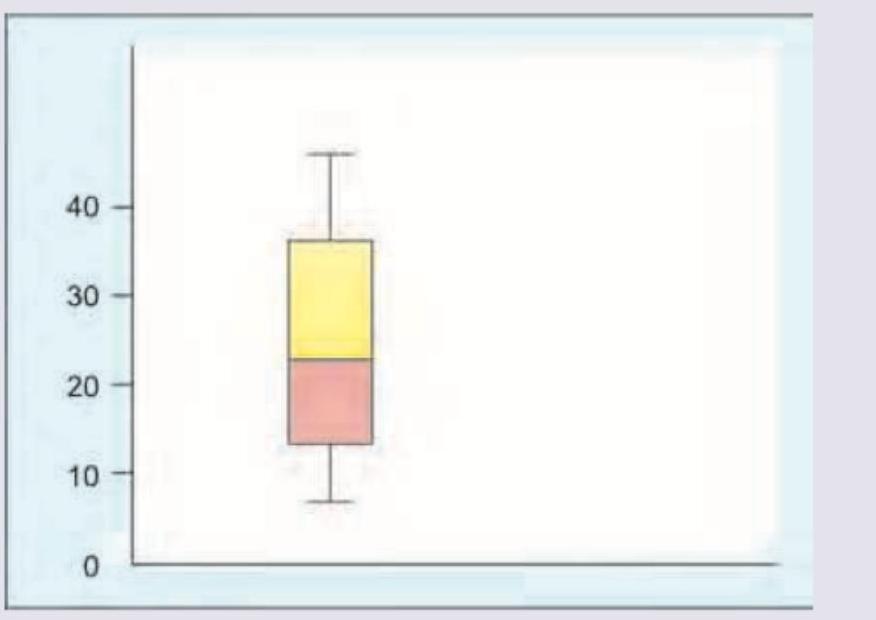
Which of the following is true about the box plot shown?
Which is incorrect about the image shown below?

A study was conducted to evaluate the diagnostic accuracy of ECG for detecting myocardial infarction. The results are shown in the 2x2 table below: Myocardial Infarction Present Absent Total ECG Positive 45 8,000 8,045 ECG Negative 5 32,000 32,005 Total 50 40,000 40,050 Consider the following statements: I. Sensitivity is 90%. II. Specificity is 80%. Which of the statements given above is/are correct?
A surgical department of a premier medical college conducted a study on rates of post-operative wound infection. The results of the study were negative for the proposed hypothesis. What should the department do with the results?
Cross-over type of study designs are those in which each subject serves as his/her own control. In which of the following conditions is a cross-over study not suitable ?
Consider the following statements about correlation between two variables : 1. The correlation is done between an independent variable X and a dependent variable Y. 2. The coefficient of correlation can range from -1 to ∞. 3. If coefficient of correlation (r) is equal to 1, it indicates there is no association between X and Y. 4. Correlation does not necessarily prove causation. Which of the statements given above are correct ?
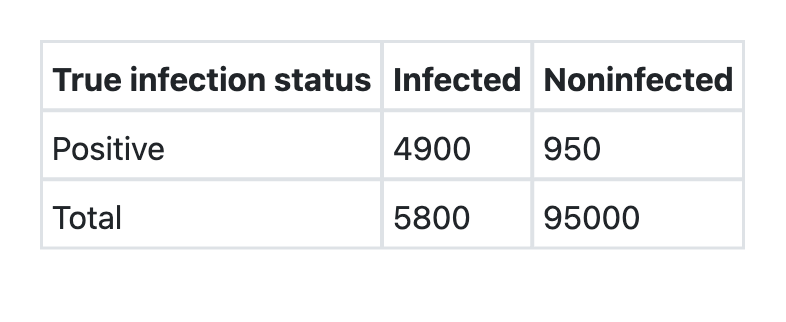
The table below shows the results of ELISA test for HIV infection : Consider the following statements : 1. The sensitivity is 98%. 2. The specificity is 99%. Which of the statements given above is/are correct?
While calculating the ‘total dependency ratio’, which one of the following is used in the denominator?
A researcher has obtained the country-level data on the average Body Mass Index (BMI) and the average sugar intake for 100 countries. Which among the following will be best suited to present the relationship between BMI and sugar intake in the 100 countries?
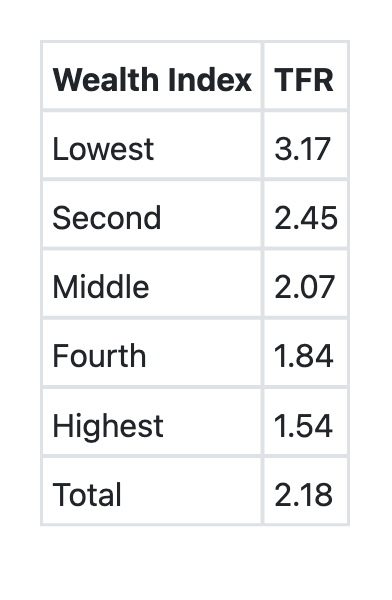
The following table shows the 'Total Fertility Rate (TFR)' by the Wealth Index, as per the National Family Health Survey, (NFHS–4) findings. Which among the following is/are correct about the information?
Practice by Chapter
Collection and Presentation of Data
Practice Questions
Measures of Central Tendency
Practice Questions
Measures of Dispersion
Practice Questions
Normal Distribution
Practice Questions
Sampling Methods
Practice Questions
Sample Size Calculation
Practice Questions
Hypothesis Testing
Practice Questions
Tests of Significance
Practice Questions
Correlation and Regression
Practice Questions
Survival Analysis
Practice Questions
Multivariate Analysis
Practice Questions
Statistical Software in Research
Practice Questions
Want unlimited practice?
Get full access to all questions, explanations, and performance tracking.
Scan to download app