
Biostatistics — MCQs

On this page
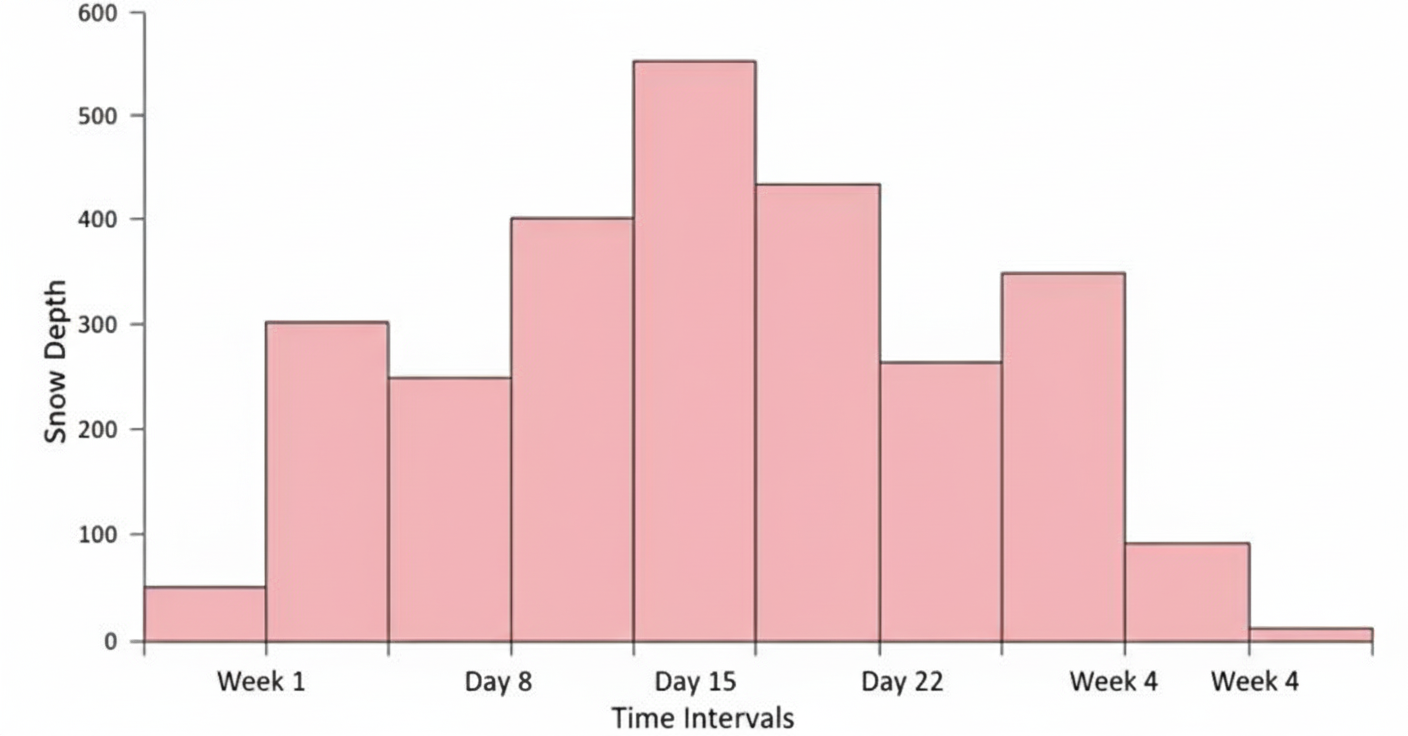
You are posted in the Army Medical Corps. The company officer is briefing you over the depth of snow in Rohtang pass over the period of last one month. This diagram is called as:
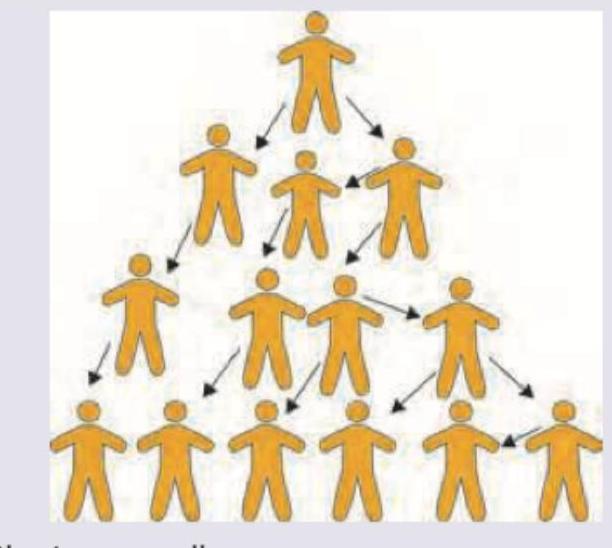
The person on the upper part of the image is an IV drug abuser who is undergoing rehabilitation. The people shown are either sexual contacts or person with whom he had shared a needle. From those contacts further information leads to multiple such drug addicts in the community who had not sought medical services till now. This is an example of:
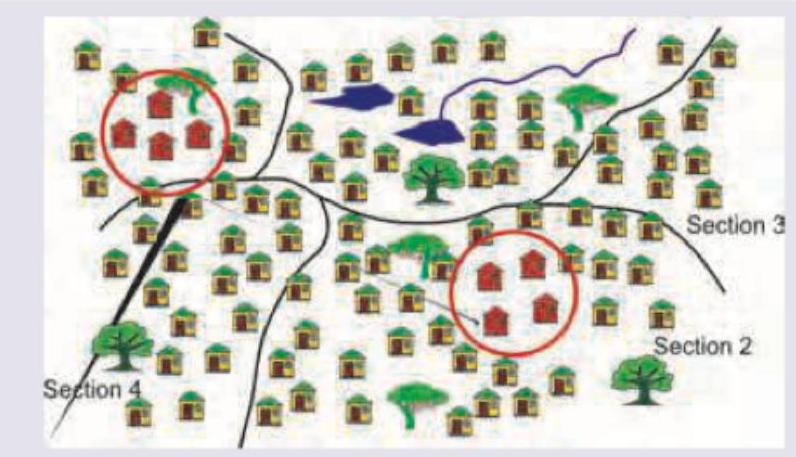
This is a map of an urban slum in New Delhi. The medical officer of PHC notified the higher authorities on observing multiple cases of measles in 1-2 years age group. The authorities conducted a survey of vaccine coverage in the area in the manner shown below. Which sampling is depicted here?
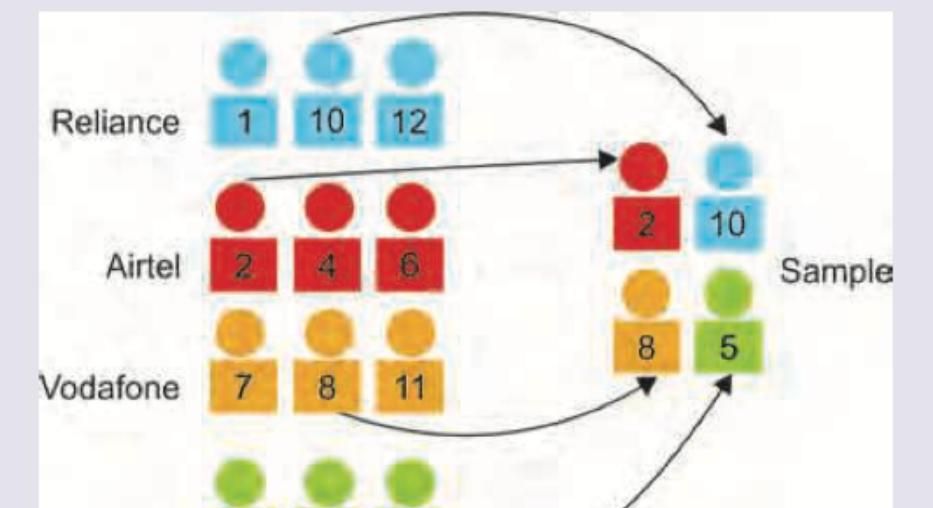
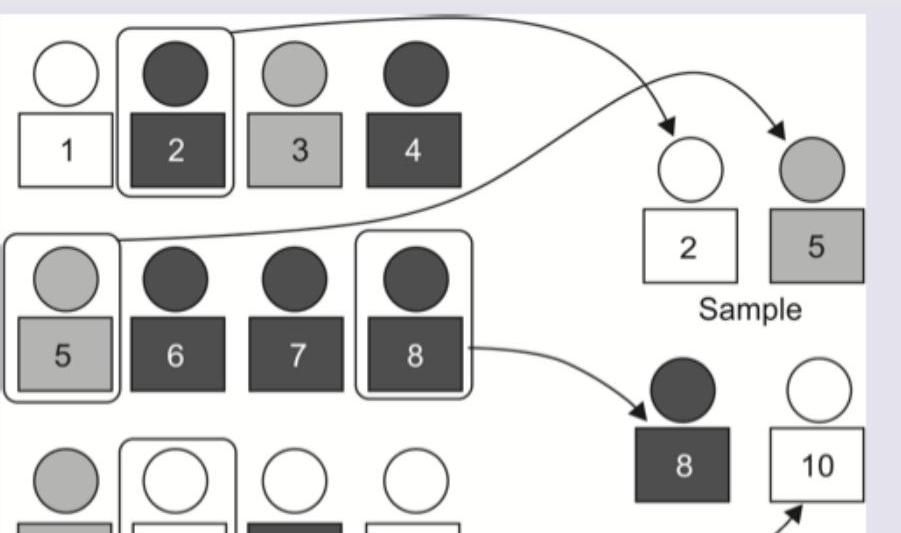
A professor at AIIMS was asked to conduct a study on hazardous effects of cellphone use on health of urban Indians. He selected the study group in the fashion shown below. It indicates:
The given image shows which kind of sampling?
In the following diagram which is correct?
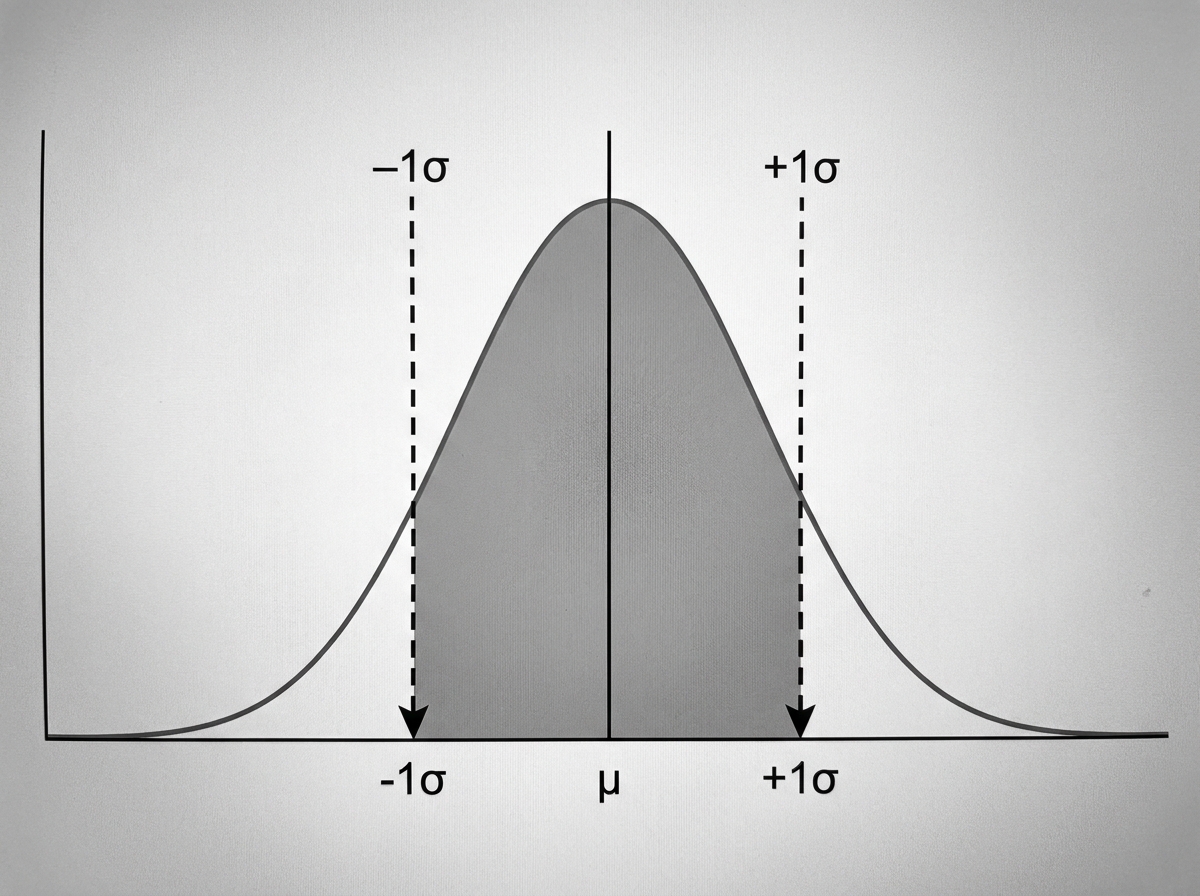
What is the area under the curve between the earmarked points?
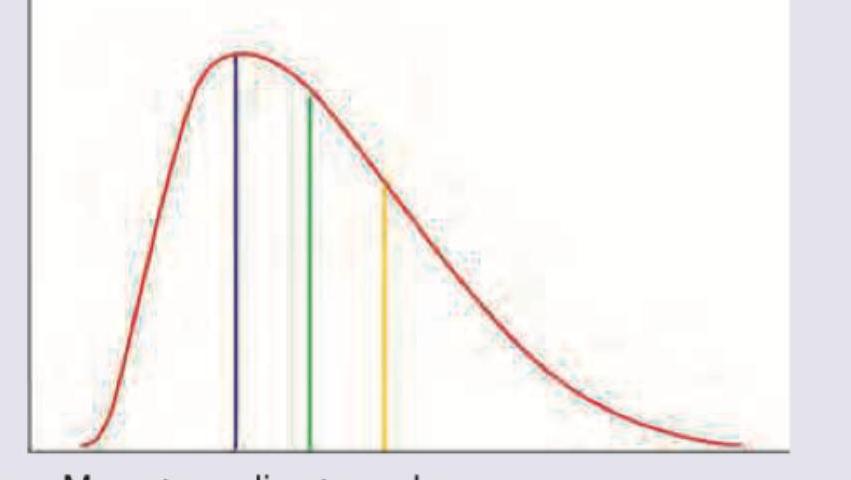
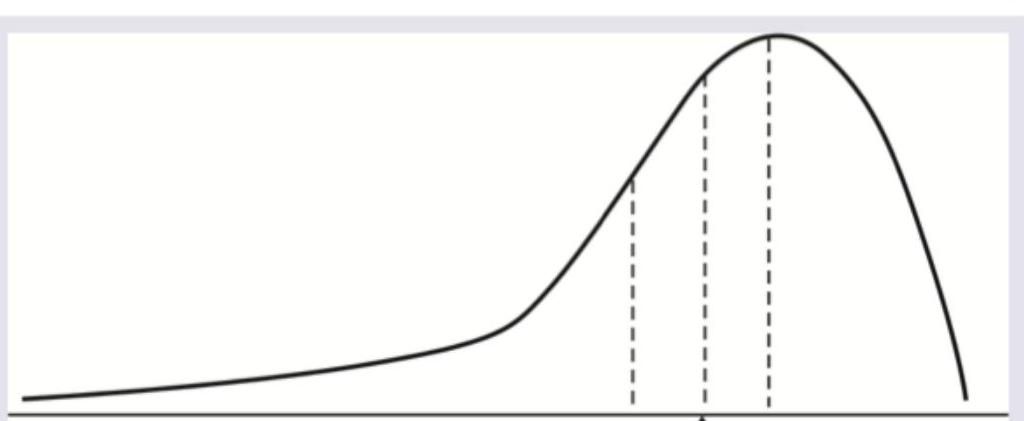
What is correct about the distribution curve shown below?
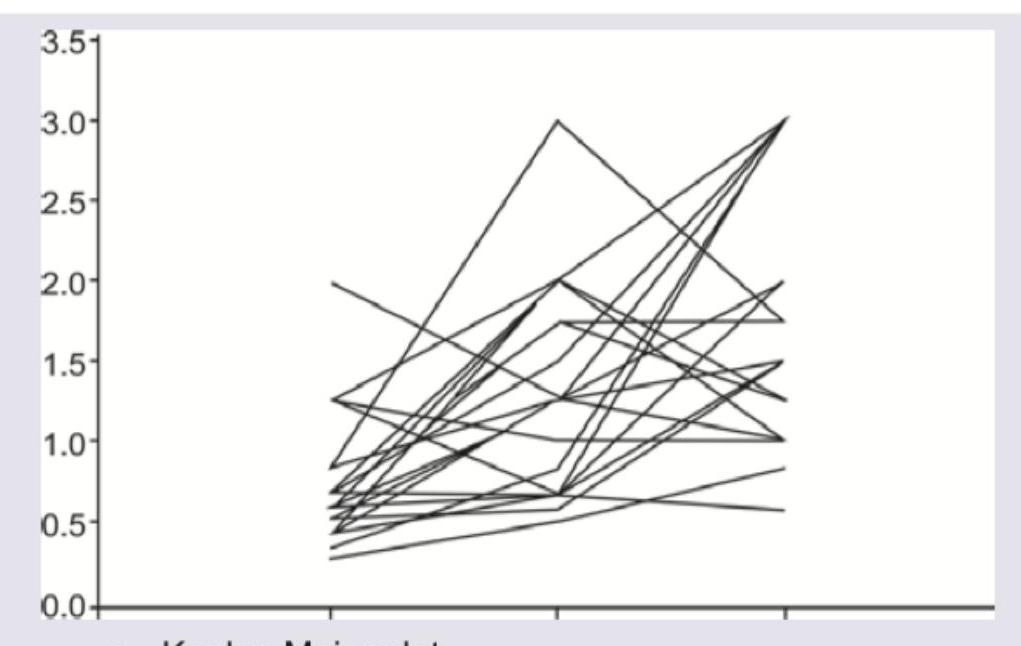
The following plot comparing pharmacokinetics of different ibuprofen brands is called:
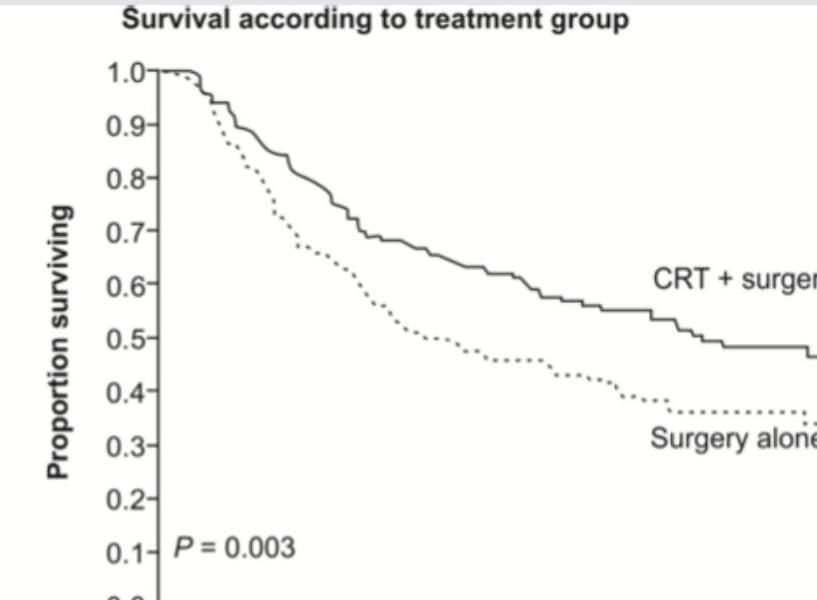
The following statistical diagram is called
Practice by Chapter
Collection and Presentation of Data
Practice Questions
Measures of Central Tendency
Practice Questions
Measures of Dispersion
Practice Questions
Normal Distribution
Practice Questions
Sampling Methods
Practice Questions
Sample Size Calculation
Practice Questions
Hypothesis Testing
Practice Questions
Tests of Significance
Practice Questions
Correlation and Regression
Practice Questions
Survival Analysis
Practice Questions
Multivariate Analysis
Practice Questions
Statistical Software in Research
Practice Questions
Want unlimited practice?
Get full access to all questions, explanations, and performance tracking.
Scan to download app