
Biostatistics — MCQs

On this page
Regarding the chi-square test, which of the following statements is true?
What is a case-control study?
If the annual growth rate of a population is 1.5-2%, what number of years will be required to double the population?
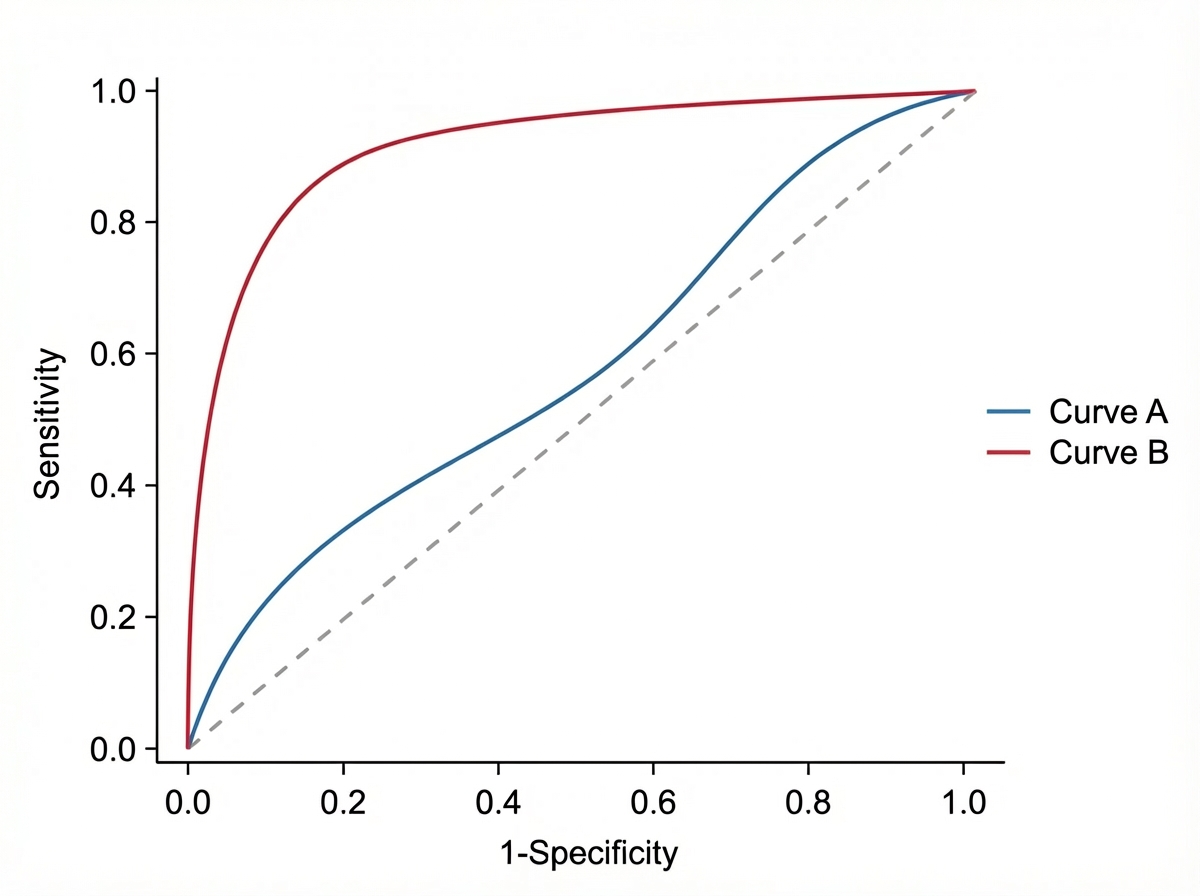
Observe the following curves. What will happen to Sensitivity and Specificity if the curve changes from Blue to Red?
A study was conducted to analyze the degrees of freedom for a dataset. The data points for 'Material Location' were recorded as (X, Y) coordinates: Glass (8, 23), Cupboard (56, 3), and Metal (1, 14). What is the calculated degree of freedom for this dataset?
Which statistical test is used to compare Kaplan-Meier survival curves?
A standard normal distribution has which of the following characteristics?
What is the best method to remove confounding?
In a study, 30 out of 50 smokers developed lung cancer, and 10 out of 50 non-smokers developed lung cancer. What is the odds ratio?
Which of the following is true regarding case-control studies?
Practice by Chapter
Collection and Presentation of Data
Practice Questions
Measures of Central Tendency
Practice Questions
Measures of Dispersion
Practice Questions
Normal Distribution
Practice Questions
Sampling Methods
Practice Questions
Sample Size Calculation
Practice Questions
Hypothesis Testing
Practice Questions
Tests of Significance
Practice Questions
Correlation and Regression
Practice Questions
Survival Analysis
Practice Questions
Multivariate Analysis
Practice Questions
Statistical Software in Research
Practice Questions
Want unlimited practice?
Get full access to all questions, explanations, and performance tracking.
Scan to download app