
Biostatistics — MCQs

On this page
In a population of 100,000 people, 10 men met all the criteria for a severely debilitating disease over a 1-year period. An additional 90 men demonstrated mild symptoms but failed to meet the full criteria. Assuming a male:female ratio of 1:1 in this population, what is the male risk of being diagnosed with this disease?
Calculate the specificity of the screening test based on the following results: | Screening test results | Diseased | Not diseased | Total | |---|---|---|---| | Positive | 400 | 200 | 600 | | Negative | 100 | 600 | 700 | | Total | 500 | 800 | 1300 |
A doctor taking a history from a diabetes patient decides to use a chart to assess joint involvement. Which type of chart should be used?
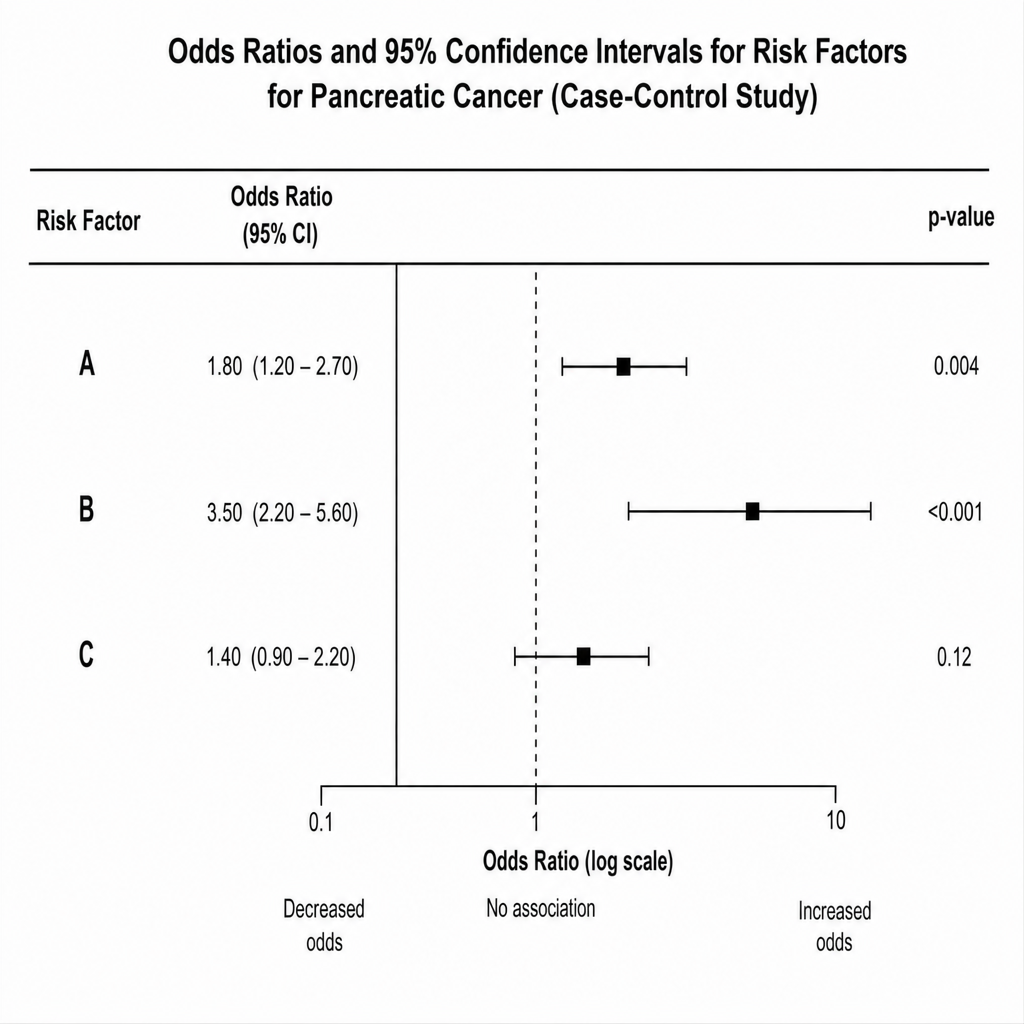
In a case-control study investigating risk factors for pancreatic cancer, the odds ratios and 95% confidence intervals for three risk factors (A, B, and C) were calculated. Which of the following statements is true regarding the association of these risk factors with pancreatic cancer?
In a hospital, out of 11 babies, 5 weighed over 2.5 kg and 5 weighed less than 2.5 kg. What value does 2.5 represent?
The fasting blood sugar (FBS) of a population is normally distributed with a mean of 105 mg% and a standard deviation of 10 mg%. Within what range will 95% of the population's FBS fall?
Specificity of a screening test measures:
The population frequency for phenylketonuria is 1 in 10,000. What is the carrier frequency for the disease?
An investigator studying the life expectancy of IV drug abusers divides a sample of patients into HIV positive and HIV negative groups. What type of data does this division constitute?
In a community, 30% of the population is below 15 years of age and 10% is over 65 years of age. What is the dependency ratio?
Practice by Chapter
Collection and Presentation of Data
Practice Questions
Measures of Central Tendency
Practice Questions
Measures of Dispersion
Practice Questions
Normal Distribution
Practice Questions
Sampling Methods
Practice Questions
Sample Size Calculation
Practice Questions
Hypothesis Testing
Practice Questions
Tests of Significance
Practice Questions
Correlation and Regression
Practice Questions
Survival Analysis
Practice Questions
Multivariate Analysis
Practice Questions
Statistical Software in Research
Practice Questions
Want unlimited practice?
Get full access to all questions, explanations, and performance tracking.
Scan to download app