
Biostatistics — MCQs

On this page
Which of the following is FALSE regarding direct standardization?
What is the most commonly used measure of dispersion in social medicine and biostatistics?
Age is an example of which of the following scales?
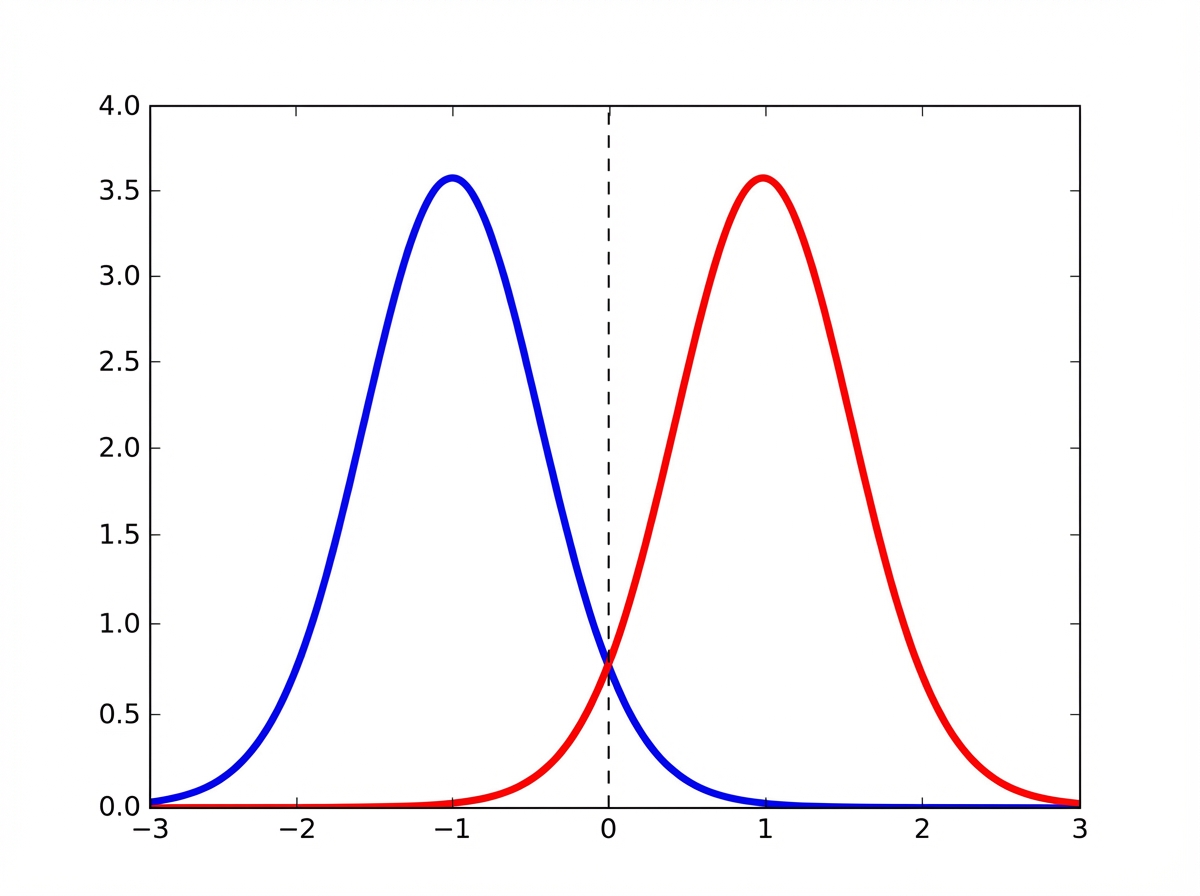
Which of the following statements accurately describes the relationship between the mean, median, and mode for the given distribution represented by the blue and red curves?
Which of the following statements is NOT true regarding cohort studies?
Which of the following are non-random sampling methods?
In a community of 5000 people, the crude birth rate is 30 per 1000 people. What is the number of pregnant females?
The list of all units in a population is called:
In a malaria survey, every 1st and 4th house was chosen for the survey. What type of sampling was used?
A diagnostic test is considered highly sensitive. What does this imply?
Practice by Chapter
Collection and Presentation of Data
Practice Questions
Measures of Central Tendency
Practice Questions
Measures of Dispersion
Practice Questions
Normal Distribution
Practice Questions
Sampling Methods
Practice Questions
Sample Size Calculation
Practice Questions
Hypothesis Testing
Practice Questions
Tests of Significance
Practice Questions
Correlation and Regression
Practice Questions
Survival Analysis
Practice Questions
Multivariate Analysis
Practice Questions
Statistical Software in Research
Practice Questions
Want unlimited practice?
Get full access to all questions, explanations, and performance tracking.
Scan to download app