
Biostatistics — MCQs

On this page
In a case-control study on smoking and lung cancer, 33 out of 35 lung cancer patients were smokers. Of 82 controls, 27 were non-smokers. Calculate the odds ratio.
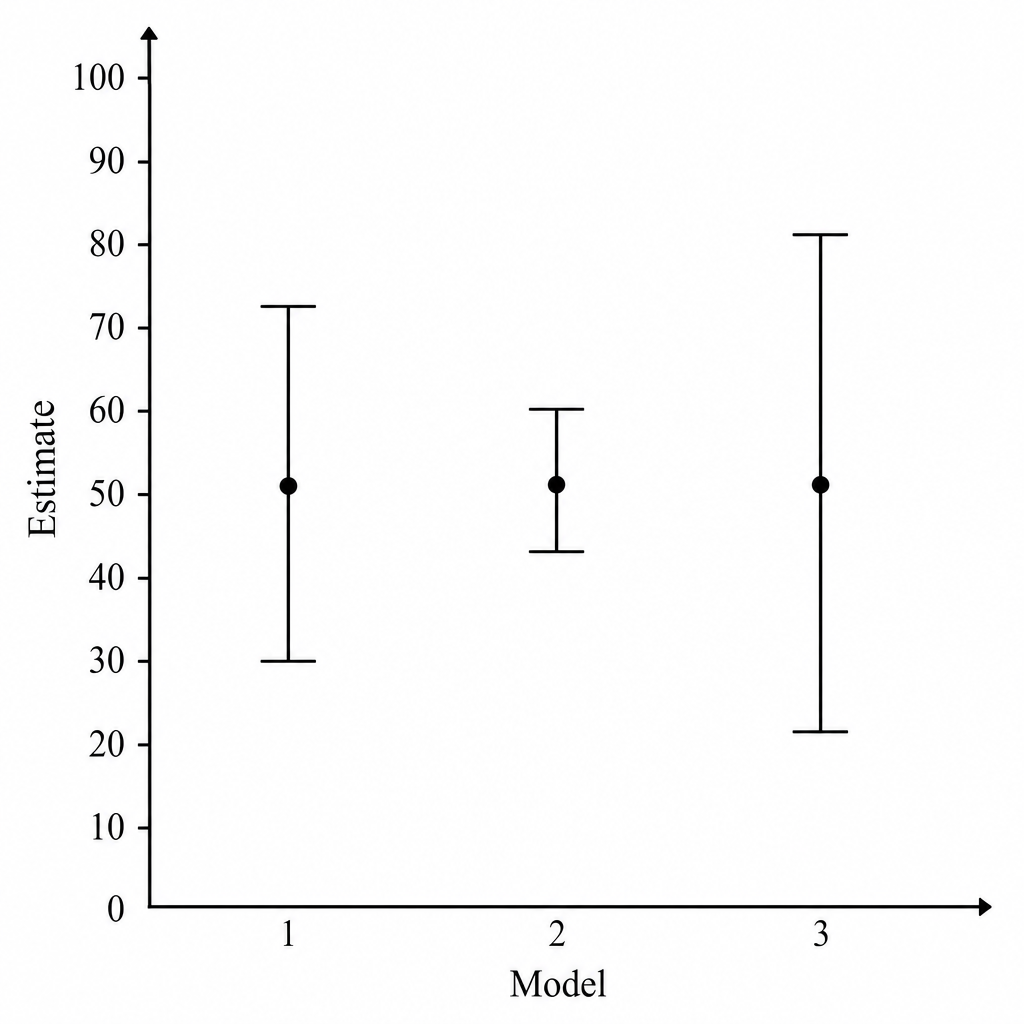
Based on the provided graph, what is the order of least margin of error?
Which of the following is not an accepted method of randomization?
A diagnostic test for a particular disease has a sensitivity of 0.90 and a specificity of 0.90. The prevalence of the disease in the population is 10%. What is the probability that a person who tests positive actually has the disease?
Which of the following statements about a cohort study is false?
In a population of 5000, with a birth rate of 30 per 1000 population, 15 children died during their first year of life in one year. Of these, 9 died during the first month of life. What is the infant mortality rate in this population?
In a study, there were 35 cases of lung carcinoma and 82 controls. Of the cases, 33 had a positive history of smoking, and 55 of the controls had a positive history of smoking. What is the odds ratio?
The dependent population in old age is generally defined as the population above what age?
An investigator is studying the impact seatbelts have on the severity of injuries incurred during a motor vehicle accident. Which of the following study designs would be most appropriate for answering this question?
Which statistic is used to measure the linear association between two characteristics in the same individuals?
Practice by Chapter
Collection and Presentation of Data
Practice Questions
Measures of Central Tendency
Practice Questions
Measures of Dispersion
Practice Questions
Normal Distribution
Practice Questions
Sampling Methods
Practice Questions
Sample Size Calculation
Practice Questions
Hypothesis Testing
Practice Questions
Tests of Significance
Practice Questions
Correlation and Regression
Practice Questions
Survival Analysis
Practice Questions
Multivariate Analysis
Practice Questions
Statistical Software in Research
Practice Questions
Want unlimited practice?
Get full access to all questions, explanations, and performance tracking.
Scan to download app