
Biostatistics — MCQs

On this page
What is the preferred measure of central tendency for ordinal data?
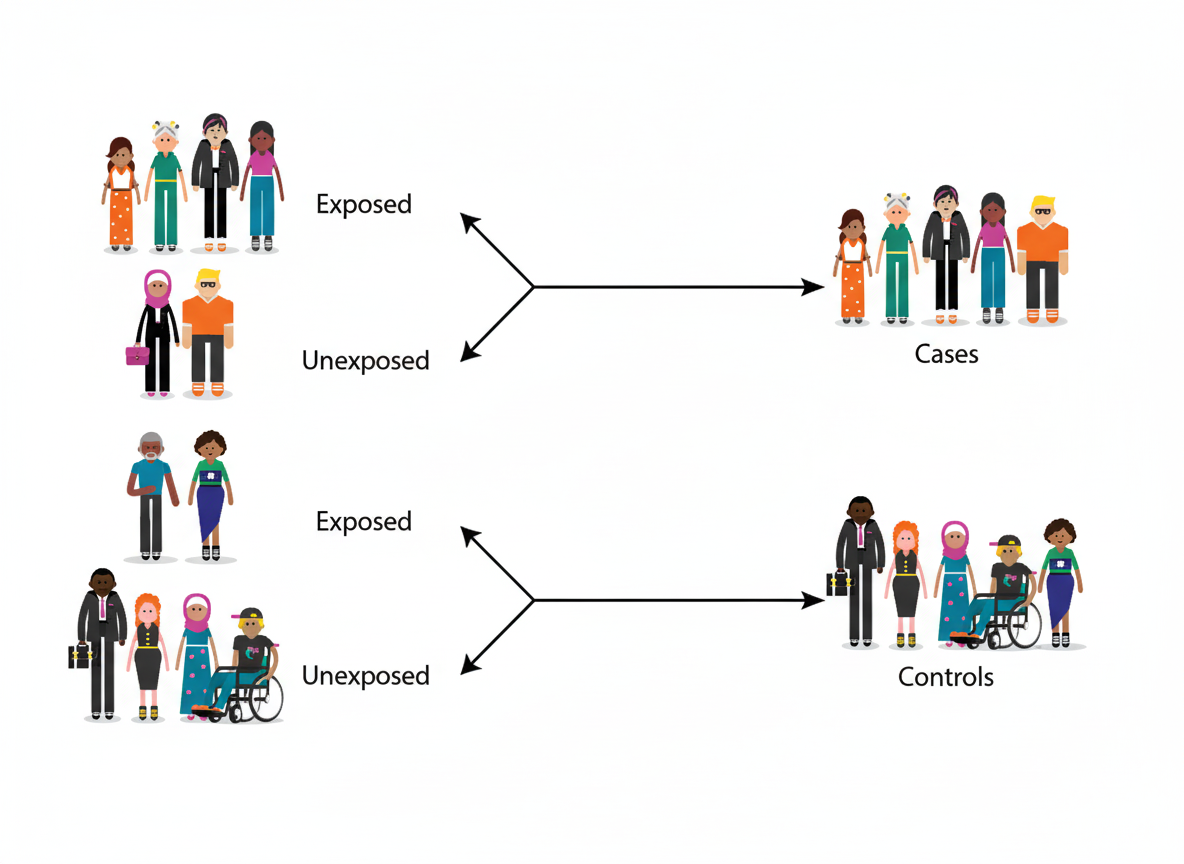
Which epidemiological study design is represented by the following illustration?
What is a disadvantage of calculating the mean?
Randomization is useful to eliminate which of the following?
A study was conducted on a group of children to assess the seasonal variation of Sudden Infant Death Syndrome (SIDS) during the summer months (June-July) and a subsequent period (August-September) in a group with similar characteristics from the same area. Which statistical test is used to compare the data from these two groups?
If a Hemoccult test is negative for screening of colonic cancer, no further test is done. If the Hemoccult test is positive, the individual will have a second stool sample tested with Hemoccult II test. If this second sample is positive for blood, the individual will be referred for more extensive evaluation. What is the effect of this screening method on net sensitivity and net specificity?
Which of the following is NOT evaluated by a cohort study?
A cessation experiment is a type of:
For the diagnosis of Deep Vein Thrombosis, two tests are done together: Impedance Plethysmography and leg scanning after injecting 125I fibrinogen. What is the primary purpose of combining these diagnostic procedures?
A screening test was carried out among 120 people. 20 had the disease, and 40 showed a positive test result, out of which 15 had the disease. What is the specificity of the test?
Practice by Chapter
Collection and Presentation of Data
Practice Questions
Measures of Central Tendency
Practice Questions
Measures of Dispersion
Practice Questions
Normal Distribution
Practice Questions
Sampling Methods
Practice Questions
Sample Size Calculation
Practice Questions
Hypothesis Testing
Practice Questions
Tests of Significance
Practice Questions
Correlation and Regression
Practice Questions
Survival Analysis
Practice Questions
Multivariate Analysis
Practice Questions
Statistical Software in Research
Practice Questions
Want unlimited practice?
Get full access to all questions, explanations, and performance tracking.
Scan to download app