
Biostatistics — MCQs

On this page
In an outbreak of cholera in a village with a population of 2,000, 20 cases have occurred and 5 individuals died. What is the case fatality rate?
Which of the following statements is NOT true regarding non-randomized trials?
Which of the following are components of validity?
Receiver operator characteristic (ROC) curve is usually drawn between which of the following parameters?
An ECG was performed on 700 subjects with complaints of acute chest pain. Of these, 520 patients had myocardial infarction. Calculate the specificity of the ECG. The results are presented in the table below: MYOCARDIAL INFARCTION ECG PRESENT | ECG ABSENT | TOTAL POSITIVE | 416 | 9 | 425 NEGATIVE | 104 | 171 | 275 TOTAL | 520 | 180 | 700
What is the purpose of double blinding in clinical trials?
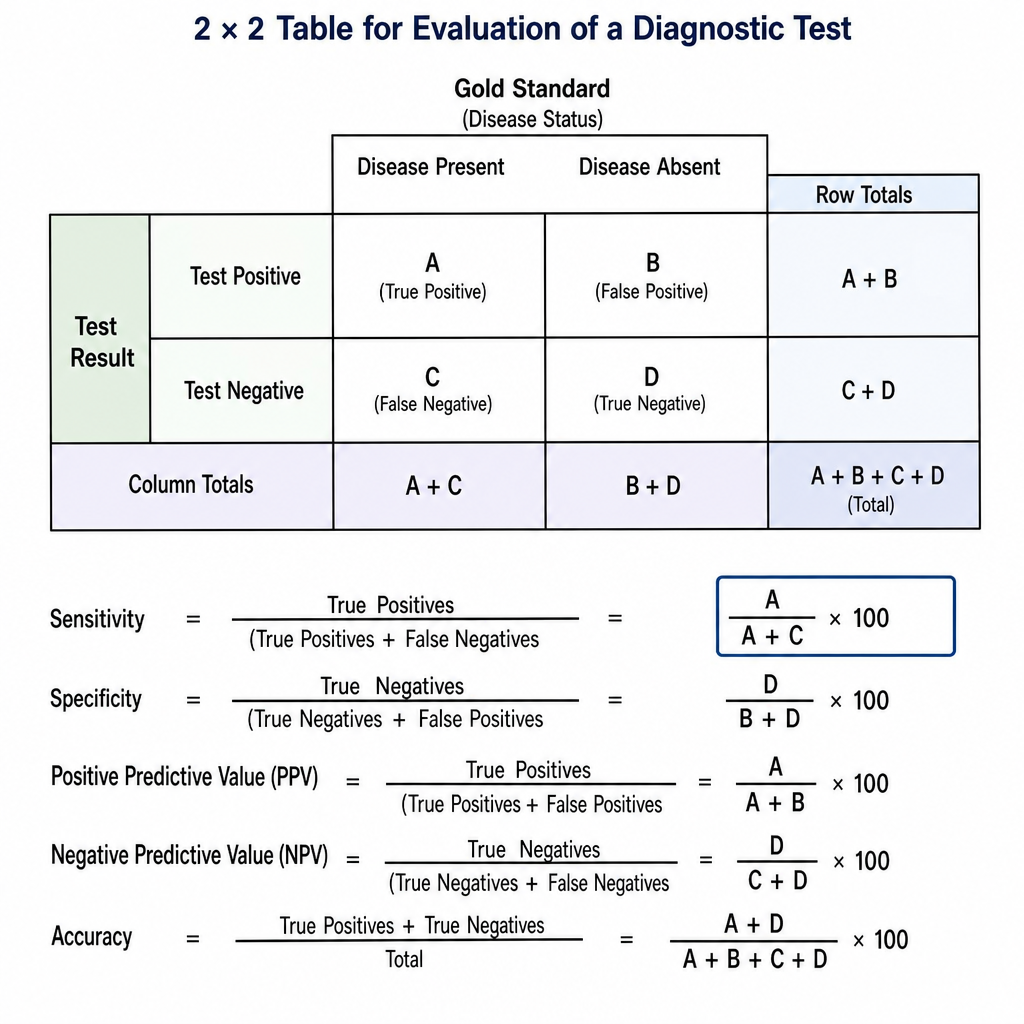
The formula (A/A+C) x 100, based on the provided table which shows test results, represents which of the following?
If the lifetime probability of developing lung cancer is 25%, what are the odds of developing lung cancer in a lifetime?
What happens to the minimum sample size when the range of allowable error is doubled?
Which of the following properties is NOT possessed by an interval variable?
Practice by Chapter
Collection and Presentation of Data
Practice Questions
Measures of Central Tendency
Practice Questions
Measures of Dispersion
Practice Questions
Normal Distribution
Practice Questions
Sampling Methods
Practice Questions
Sample Size Calculation
Practice Questions
Hypothesis Testing
Practice Questions
Tests of Significance
Practice Questions
Correlation and Regression
Practice Questions
Survival Analysis
Practice Questions
Multivariate Analysis
Practice Questions
Statistical Software in Research
Practice Questions
Want unlimited practice?
Get full access to all questions, explanations, and performance tracking.
Scan to download app