
Biostatistics — MCQs

On this page
A village is divided into five relevant subgroups for the purpose of a survey. Individuals from each subgroup are then selected randomly. What is this type of sampling called?
A chi-square test would be most appropriate for testing which one of the following hypotheses?
What is true about the standard normal distribution?
Which of the following is true about a cohort study?
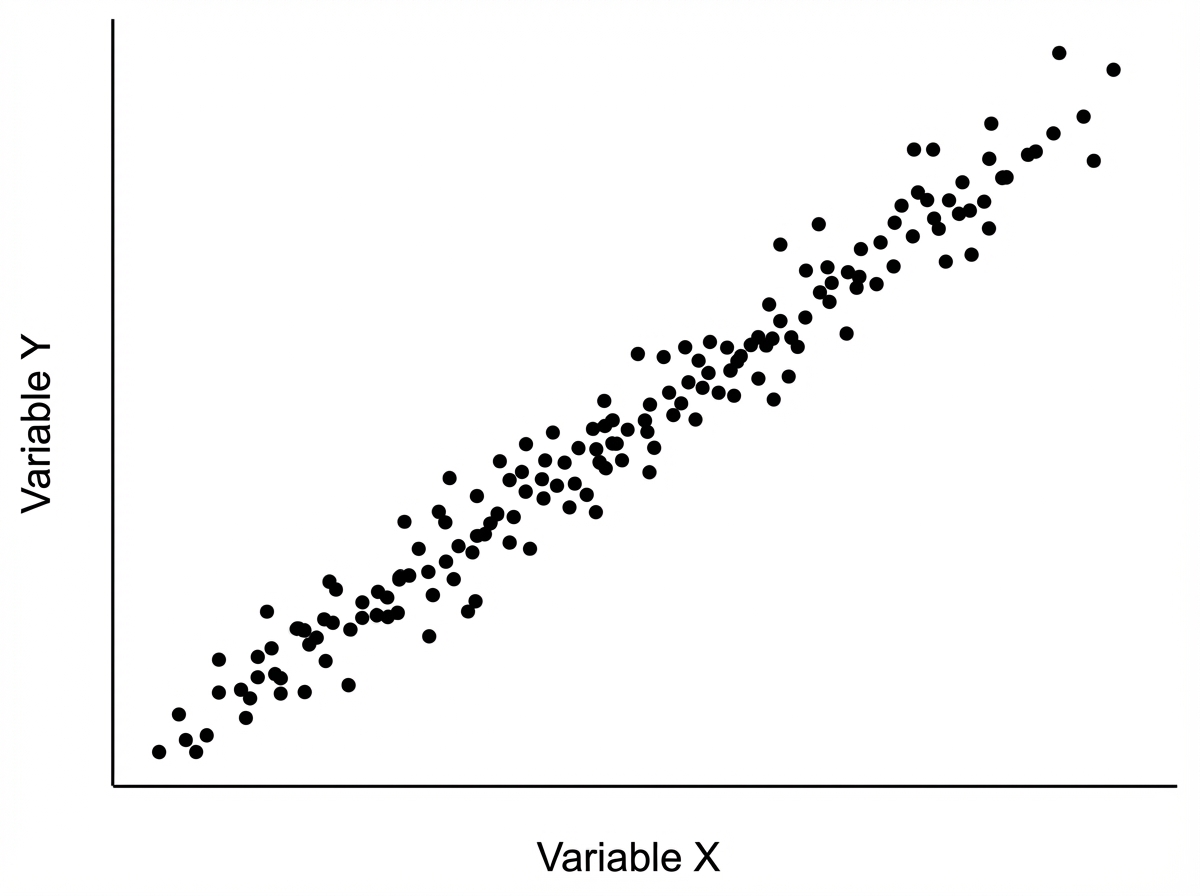
Interpret the statistical graph shown below:
If one variable is given, how can another variable be predicted?
What is the direction of a case-control study in relation to the direction of time?
Regarding the normal curve, which of the following statements is/are true?
A diagnostic test was performed on 150 individuals. The results are presented in the table below: | Test Result | Disease Present | Disease Absent | |---|---|---| | Positive Test | 40 | 5 | | Negative Test | 10 | 95 | What is the specificity of this test?
Cronbach alpha is a measure of?
Practice by Chapter
Collection and Presentation of Data
Practice Questions
Measures of Central Tendency
Practice Questions
Measures of Dispersion
Practice Questions
Normal Distribution
Practice Questions
Sampling Methods
Practice Questions
Sample Size Calculation
Practice Questions
Hypothesis Testing
Practice Questions
Tests of Significance
Practice Questions
Correlation and Regression
Practice Questions
Survival Analysis
Practice Questions
Multivariate Analysis
Practice Questions
Statistical Software in Research
Practice Questions
Want unlimited practice?
Get full access to all questions, explanations, and performance tracking.
Scan to download app