
Biostatistics — MCQs

On this page
When the mean, median, and mode of a distribution are all zero, what type of distribution is it?
Which of the following variables is measured on an ordinal scale?
Regarding crude birth rate, all are true except?
Which type of diagram best demonstrates a secular trend?
Total cholesterol level is represented by the equation: Total cholesterol level = a + b (calorie intake) + c (physical activity) + d (body mass index). This equation is an example of which type of regression?
All of the following are tests for the degree of closeness of a measured or calculated quantity to its actual or true value, except:
Which of the following is true regarding cohort studies?
In what interval is the sample registration system conducted?
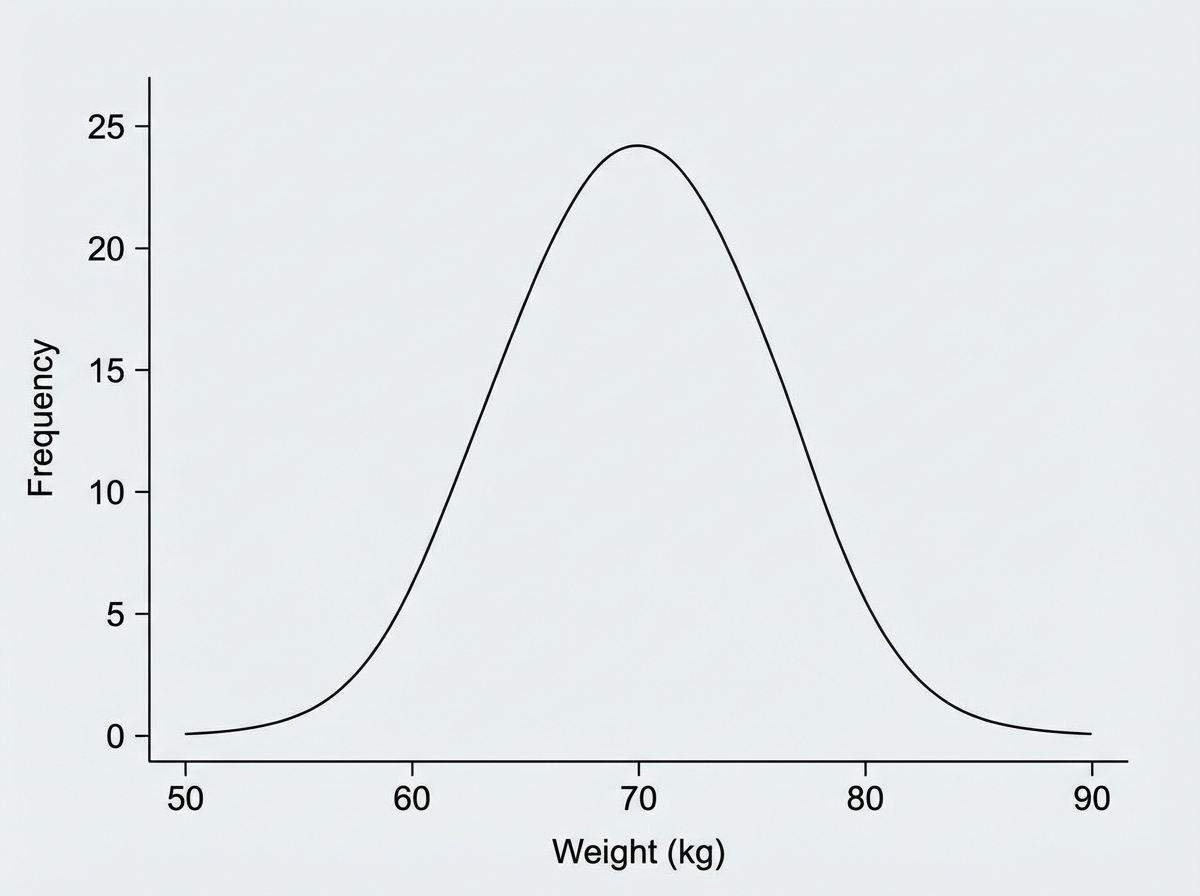
For the given distribution of weights of a group of students, which measure of central tendency is most appropriate?
A study provides the following test results for a disease: Present (40 +ve, 10 -ve), Absent (225 +ve, 225 -ve). What is the sensitivity of this study?
Practice by Chapter
Collection and Presentation of Data
Practice Questions
Measures of Central Tendency
Practice Questions
Measures of Dispersion
Practice Questions
Normal Distribution
Practice Questions
Sampling Methods
Practice Questions
Sample Size Calculation
Practice Questions
Hypothesis Testing
Practice Questions
Tests of Significance
Practice Questions
Correlation and Regression
Practice Questions
Survival Analysis
Practice Questions
Multivariate Analysis
Practice Questions
Statistical Software in Research
Practice Questions
Want unlimited practice?
Get full access to all questions, explanations, and performance tracking.
Scan to download app