
Biostatistics — MCQs

On this page
Calculate the Pearl Index for 100 women followed up for 20 months using oral contraceptive pills, of whom 5 became pregnant.
What type of study is a cohort study?
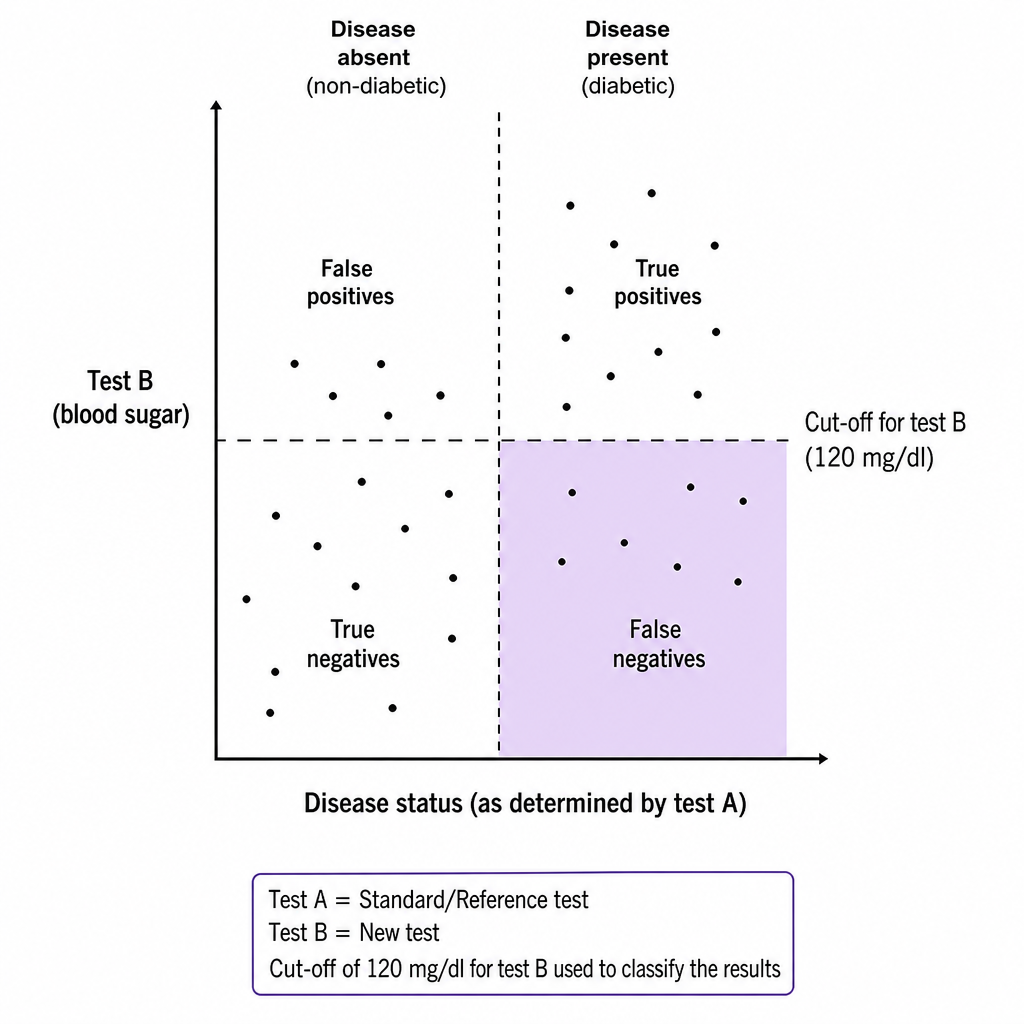
A new test, test B, for Diabetes mellitus is performed in a group containing diabetics and non-diabetics. A standard test A has been used as a reference to classify them as diabetics and non-diabetics. If 120 mg/dl of blood sugar is taken as the cut-off for test B, the area shaded in the graph below represents what?
What is the denominator for the specific death rate due to coronary artery disease?
A test has a sensitivity of 90% and a specificity of 95%. Which of the following statements is true?
The correlation coefficient between two variables x and y of -0.99 indicates which of the following?
All of the following are advantages of a case-control study except:
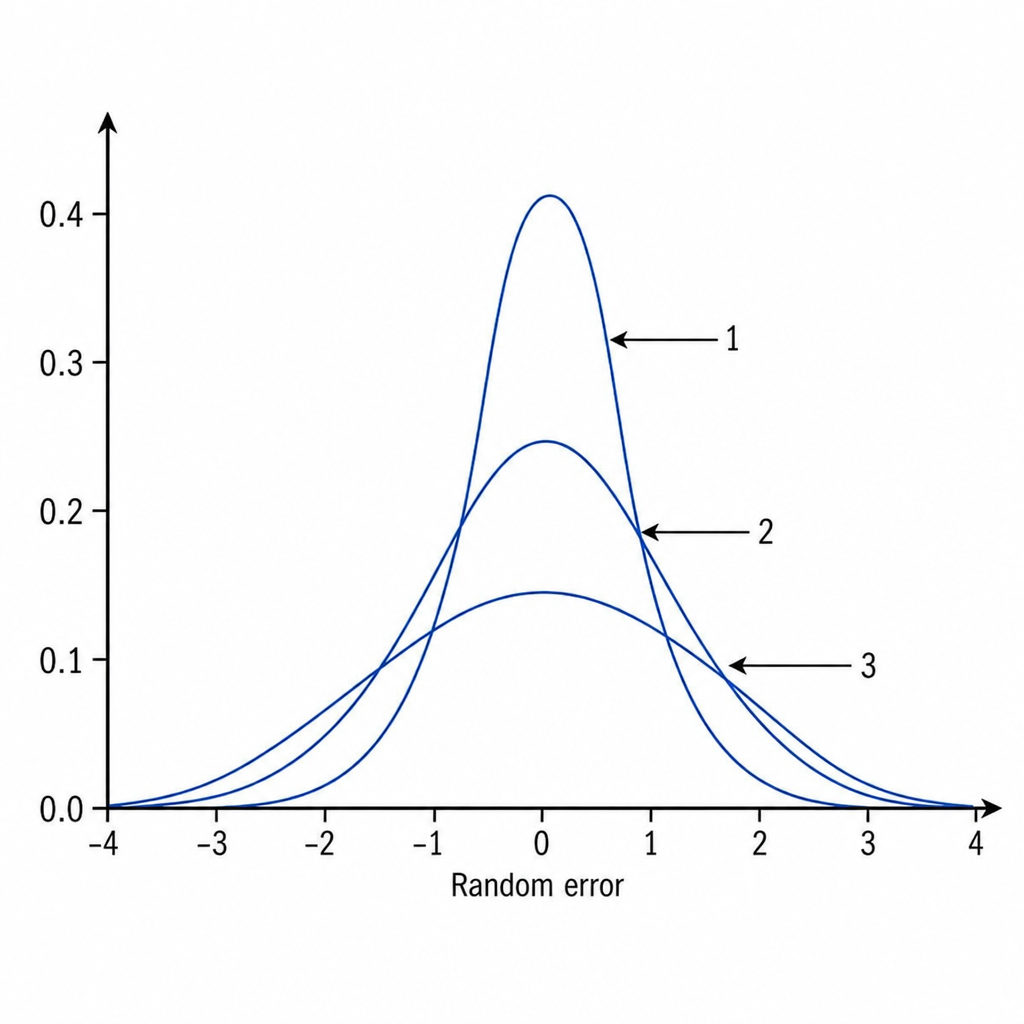
What is the order of the margin of error in the graph provided?
A cardiologist wants to study the effect of an antihypertensive drug. He notes down the initial systolic blood pressure (mmHg) of 50 patients and then administers the drug. After a week's treatment, he measures the systolic blood pressure again. Which of the following is the most appropriate statistical test of significance to test the statistical significance of the change in blood pressure?
Which of the following is used for qualitative data?
Practice by Chapter
Collection and Presentation of Data
Practice Questions
Measures of Central Tendency
Practice Questions
Measures of Dispersion
Practice Questions
Normal Distribution
Practice Questions
Sampling Methods
Practice Questions
Sample Size Calculation
Practice Questions
Hypothesis Testing
Practice Questions
Tests of Significance
Practice Questions
Correlation and Regression
Practice Questions
Survival Analysis
Practice Questions
Multivariate Analysis
Practice Questions
Statistical Software in Research
Practice Questions
Want unlimited practice?
Get full access to all questions, explanations, and performance tracking.
Scan to download app