
Biostatistics — MCQs

On this page
Which of the following is NOT a measure of dispersion?
Which of the following is NOT an observational study?
The incidence of malaria in an area is reported as 20, 20, 50, 56, 60, 5000, 678, 898, 345, 456. Which of these methods is the best to calculate the average incidence in this dataset?
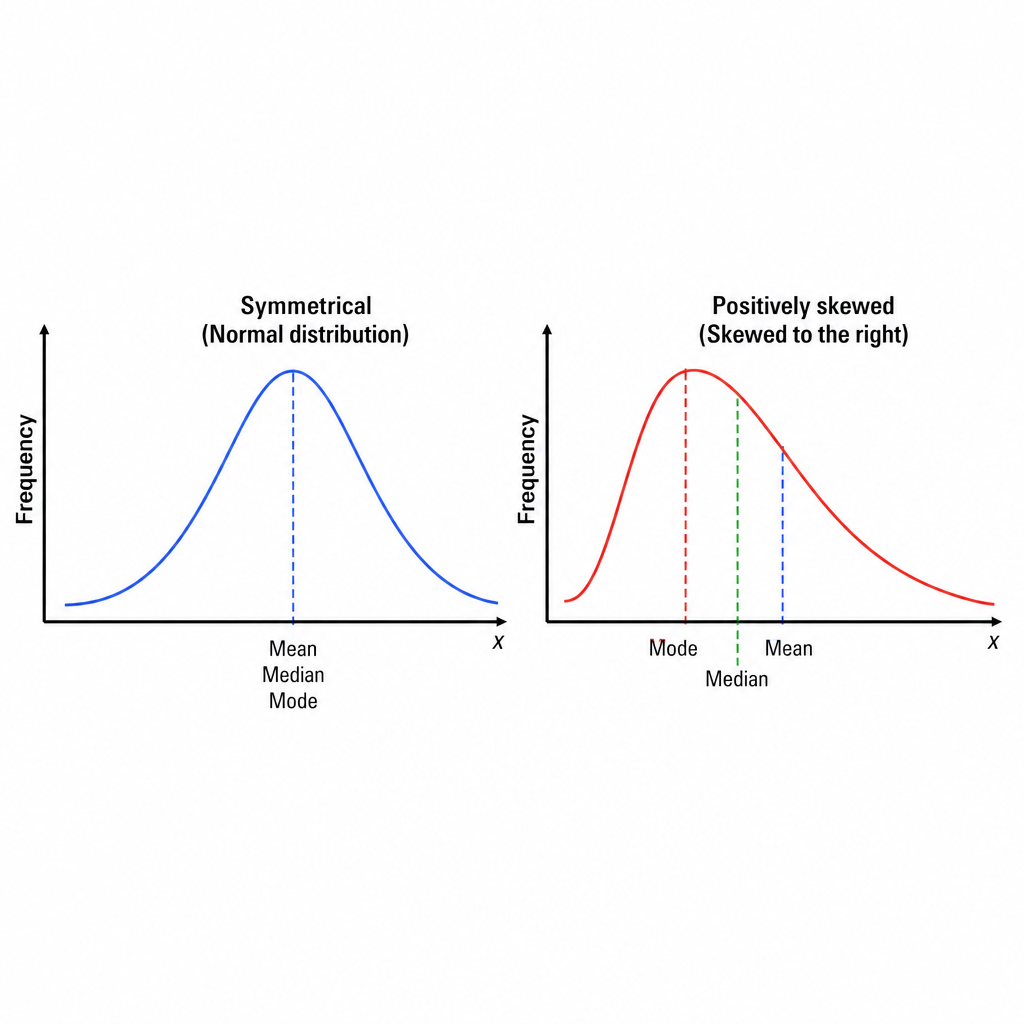
Which of the following best describes the relationship between Mean, Median, and Mode for the given two curves (blue and red)?
Calculate the stillbirth rate per 1000 population in 2012, given the following data: neonatal deaths = 450, number of stillbirths = 2, number of live births = 12,450.
What is the likelihood ratio for positive results?
In a village with 180 eligible couples, family planning data of contraceptive method usage is as follows: Sterilization (Vasectomy-3, Tubectomy-8), IUD users-10, Oral pill users-10, Condom users-29. What is the effective Couple Protection Rate (CPR) in the village?
All of the following statements regarding case-control and cohort studies are true, except-
What is the Gross Fecundity Rate?
Which of the following study designs does NOT show a cause-to-effect progression?
Practice by Chapter
Collection and Presentation of Data
Practice Questions
Measures of Central Tendency
Practice Questions
Measures of Dispersion
Practice Questions
Normal Distribution
Practice Questions
Sampling Methods
Practice Questions
Sample Size Calculation
Practice Questions
Hypothesis Testing
Practice Questions
Tests of Significance
Practice Questions
Correlation and Regression
Practice Questions
Survival Analysis
Practice Questions
Multivariate Analysis
Practice Questions
Statistical Software in Research
Practice Questions
Want unlimited practice?
Get full access to all questions, explanations, and performance tracking.
Scan to download app