Q11
A cohort study was conducted among 200 men aged 20–30 years in Rampur village. Out of 200, 120 men were tobacco users and rest 80 didn’t take any form of tobacco. At the end of one year, 40 men among tobacco users and 10 men among non-tobacco users developed tuberculosis. The incidence of tuberculosis among tobacco users is:
Q12
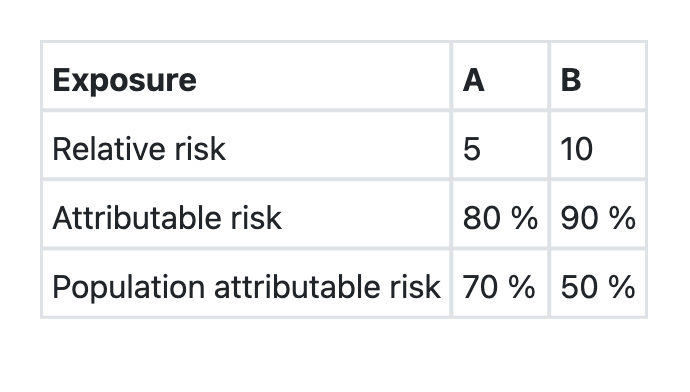
The data regarding two exposures A and B, associated with a disease X in a community is given below: Which one of the following assertions and the reasons given is correct?
Q13
Which of the following types of study designs will be most appropriate to find out the association between mobile phone radiation exposure and cancer?
Q14
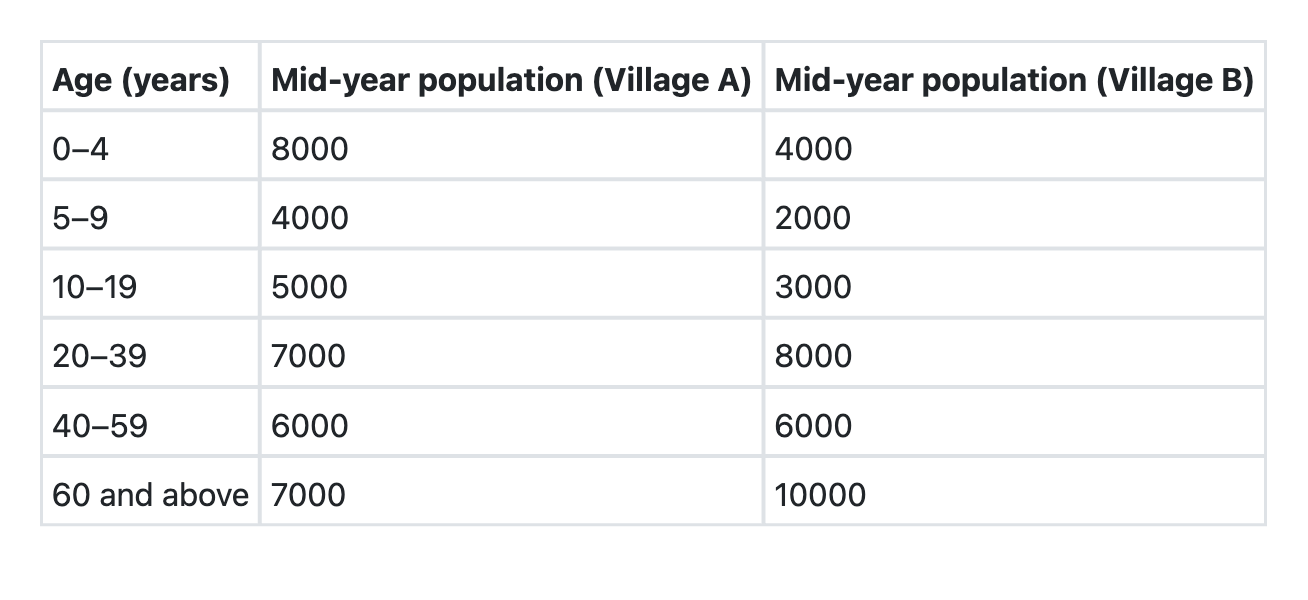
The villages A and B have the following age compositions: Which of the following is the best indicator for comparing the death rates of these two villages?
Q15
Which of the following is/are suggested by rising incidence rates of any disease? 1. Need for a new disease control programme 2. Improvement in reporting practices 3. Change in the etiology of the disease Select the correct answer using the codes given below:
Q16
What constitutes the denominator in ‘Total Dependency Ratio’?
Q17
By which one of the following studies can relative risk be best calculated?
Q18
Orthotolidine (OT) test is done for determining residual free chlorine quantitatively and qualitatively. What is the colour of the solution after adding OT which indicates presence of free chlorine?
Q19
Consider the following in respect of Navjyot Shishu Suraksha Karyakram (NSSK): 1. It is a programme aimed to train health personnel in basic newborn care and resuscitation 2. It addresses care at birth issues (i.e. prevention of hypothermia, prevention of infection, early initiation of breastfeeding and basic newborn resuscitation) 3. The objective is to have a trained health person in basic newborn care and resuscitation at every delivery point Which of the statements given above are correct?
Q20
The most important indicator for assessment of impact in Salt Iodization Programme is: