UPSC-CMS 2018
119 Previous Year Questions with Answers & Explanations
Community Medicine
9 questionsWhat are the characteristics of ideal health indicators?
Which one of the following statements regarding predictive value of a positive test is true?
The yield of a screening test CAN NOT be increased by which of the following?
Which one of the following statements regarding the growth chart is NOT true?
A well of contaminated water resulted in an outbreak of diarrhoea in a community. Which type of epidemic will this exposure present with? 1.Propagated epidemic 2.Common source - continuous exposure 3.Common source - point exposure
Which one of the following experiments/trials is a part of non-randomized trials?
What is the relative risk of developing tuberculosis among tobacco users as per the information given below?
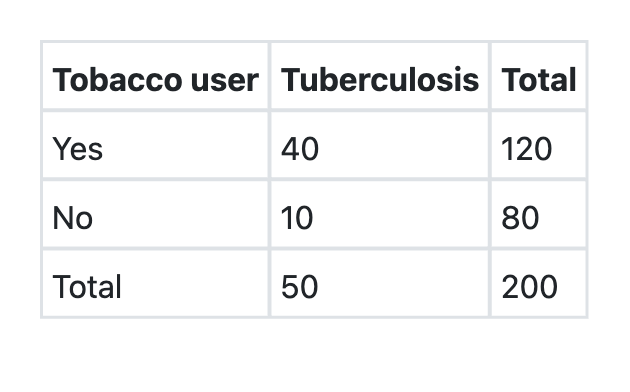
What is the attributable risk percent (etiologic fraction) of tobacco for developing tuberculosis as per the information given below? Tobacco users Tuberculosis Total Present Absent Yes 40 80 120 No 10 70 80 Total 50 150 200
What is the sensitivity of EEG for detecting brain tumours as per the information given below?
UPSC-CMS 2018 - Community Medicine UPSC-CMS Practice Questions and MCQs
Question 1: What are the characteristics of ideal health indicators?
- A. They should be mainly valid, reliable and relevant but need not be feasible
- B. They should be mainly valid, reliable and sensitive but need not be specific
- C. They should be mainly valid, reliable and feasible but need not be sensitive
- D. They should be valid, reliable, sensitive, specific, feasible and relevant (Correct Answer)
Explanation: ***They should be valid, reliable, sensitive, specific, feasible and relevant*** - Ideal health indicators must possess **all six characteristics** to be truly effective for public health assessment and decision-making - **Validity** ensures they measure what they're intended to measure - **Reliability** guarantees consistent and reproducible results - **Sensitivity** detects all true positive cases (minimizes false negatives) - **Specificity** correctly identifies true negatives (minimizes false positives) - **Feasibility** makes them practical, cost-effective, and routinely collectable - **Relevance** ensures they are meaningful for health policy and programmatic decisions *They should be mainly valid, reliable and relevant but need not be feasible* - While **validity**, **reliability**, and **relevance** are crucial, neglecting **feasibility** would render indicators impractical and costly to implement - An indicator that cannot be routinely collected or analyzed due to resource constraints is not ideal for ongoing public health surveillance, regardless of its statistical soundness *They should be mainly valid, reliable and sensitive but need not be specific* - While **validity**, **reliability**, and **sensitivity** are important, a lack of **specificity** would lead to a high number of **false positives** - This results in misallocation of scarce resources and unnecessary interventions for individuals who are not truly affected by the health condition being monitored *They should be mainly valid, reliable and feasible but need not be sensitive* - While **validity**, **reliability**, and **feasibility** are essential, an indicator that lacks **sensitivity** would miss a significant number of actual cases (**false negatives**) - This means the true burden of disease or health problem could be underestimated, leading to inadequate public health responses and insufficient allocation of interventions
Question 2: Which one of the following statements regarding predictive value of a positive test is true?
- A. It does not tell about diagnostic power of test
- B. The more prevalent the disease, the less accurate the test is
- C. It tells the probability that a patient with positive test does not have the disease in question
- D. It tells the probability that a patient with positive test has the disease in question (Correct Answer)
Explanation: ***It tells the probability that a patient with positive test has the disease in question*** - The **positive predictive value (PPV)** is the probability that an individual with a **positive test result** actually has the disease. - It helps clinicians understand the likelihood of a true positive diagnosis in a given population. *It does not tell about diagnostic power of test* - While PPV is influenced by disease prevalence, it is a crucial measure of a test's **diagnostic utility** in a clinical setting. - It helps in interpreting the meaning of a positive result for an individual patient. *The more prevalent the disease, the less accurate the test is* - This statement is incorrect; the **higher the prevalence**, the **higher the positive predictive value** (PPV) of a test, assuming sensitivity and specificity remain constant. - Test accuracy (sensitivity and specificity) is independent of disease prevalence. *It tells the probability that a patient with positive test does not have the disease in question* - This describes the **false positive rate** or **1 - positive predictive value (PPV)**, not the PPV itself. - The PPV specifically refers to the probability of having the disease given a positive result.
Question 3: The yield of a screening test CAN NOT be increased by which of the following?
- A. Including high risk population
- B. Improved sensitivity
- C. Improved specificity
- D. Including entire population (Correct Answer)
Explanation: ***Including entire population*** - Including the entire population, especially if it contains many individuals at **low risk** for the disease, would lead to a larger number of tests performed with a comparatively lower number of positive results, thus **decreasing the yield**. - **Screening yield** refers to the proportion of positive test results in the screened population or the number of new cases identified, and including a large low-risk group dilutes this proportion. *Including high risk population* - Targeting a **high-risk population** increases the **prevalence** of the disease within the screened group, leading to more true positives and a higher yield. - This strategy ensures that screening resources are focused on those most likely to benefit from early detection. *Improved sensitivity* - A screening test with **improved sensitivity** is better at identifying individuals who truly have the disease, leading to fewer **false negatives**. - By increasing the detection rate of actual cases, higher sensitivity directly contributes to a **greater screening yield** by detecting more true positive cases. *Improved specificity* - A screening test with **improved specificity** is better at correctly identifying individuals who do not have the disease, leading to fewer **false positives**. - However, improved specificity **does not increase the number of true cases detected**—it only reduces false positives, thus improving the **positive predictive value (PPV)** but not necessarily the screening yield itself. - While it makes positive results more reliable, it does not contribute to finding more actual disease cases in the population.
Question 4: Which one of the following statements regarding the growth chart is NOT true?
- A. It is used as a tool for growth monitoring and diagnosis
- B. It is used for planning and policy making
- C. It is used as a tool for action against the Anganwadi worker (Correct Answer)
- D. It is used as a tool for teaching and evaluation of effectiveness of programme
Explanation: ***It is used as a tool for action against the Anganwadi worker*** - The primary purpose of a growth chart is to **monitor child growth**, provide insights into health status, and evaluate interventions, not to penalize workers. - Using it as a punitive tool goes against its intended use for **health promotion** and programmatic improvement. *It is used as a tool for growth monitoring and diagnosis* - Growth charts are essential for **tracking a child's physical development** over time, allowing for early detection of growth faltering or excessive weight gain. - They aid in the **diagnosis of malnutrition** (underweight, stunting, wasting) or overweight/obesity by comparing individual measurements to population standards. *It is used for planning and policy making* - Data aggregated from growth charts can inform **public health planning** by identifying areas with high prevalence of malnutrition and allocating resources effectively. - They provide crucial evidence for **policy formulation** aimed at improving child health and nutrition outcomes at local, regional, and national levels. *It is used as a tool for teaching and evaluation of effectiveness of programme* - Growth charts serve as an excellent **educational tool** for parents, healthcare workers, and community health volunteers to understand healthy growth patterns and nutritional needs. - They are vital for **evaluating the impact of health and nutrition programs** by demonstrating changes in growth trends and nutritional status over time.
Question 5: A well of contaminated water resulted in an outbreak of diarrhoea in a community. Which type of epidemic will this exposure present with? 1.Propagated epidemic 2.Common source - continuous exposure 3.Common source - point exposure
- A. 1, 2 and 3
- B. 2 only
- C. 1 and 2 only
- D. 3 only (Correct Answer)
Explanation: ***3 only*** - A **common source - point exposure** epidemic occurs when a group of people are exposed to the same harmful source over a relatively **short, defined period**. A contaminated well represents a single source of exposure, and the diarrhea outbreak suggests a rapid onset of illness within the community after this exposure. - The contamination of a well provides a **single, acute event** where affected individuals are exposed around the same time leading to a sharp increase in cases, followed by a decline. *1, 2 and 3* - This option is incorrect because a **propagated epidemic** typically involves person-to-person transmission, which is not the primary mode described for a contaminated water source that causes a widespread outbreak. - A **common source - continuous exposure** involves ongoing or intermittent exposure over a prolonged period, leading to a flatter epidemic curve or multiple peaks, which is less likely for a singular contaminated well event unless the contamination lasts for an extended time. *2 only* - This is incorrect because **common source - continuous exposure** implies prolonged or repeated exposure to the source, potentially due to ongoing contamination of the well, leading to cases occurring over an extended period. - While a contaminated well could potentially lead to continuous exposure if the contamination persists and goes unaddressed, the phrasing "a well of contaminated water resulted in an outbreak" suggests an event with a more defined timeline, fitting point exposure initially. *1 and 2 only* - This option is incorrect because a **propagated epidemic** is characterized by the spread of disease from person to person, often resulting in multiple waves of cases, which is not the primary pattern expected from a contaminated water source. - While continuous exposure could describe a contaminated well that remains active, the initial description of "an outbreak" from a single source often points more directly to a **point exposure** event in its initial phase.
Question 6: Which one of the following experiments/trials is a part of non-randomized trials?
- A. Before and after comparison studies
- B. Natural experiment
- C. Risk factor trial
- D. Uncontrolled trial (Correct Answer)
Explanation: ***Uncontrolled trial*** - An **uncontrolled trial** is a single-arm study where all participants receive the same intervention without any control group for comparison. - These are classified as **non-randomized trials** because there is no random allocation between groups (as there is only one group). - Common in early phase drug studies or when ethical considerations prevent withholding treatment. *Before and after comparison studies* - While these are **non-randomized designs**, they are typically classified as **quasi-experimental studies** rather than trials in strict epidemiological terminology. - They measure outcomes in the same population before and after an intervention without random allocation. *Natural experiment* - A **natural experiment** is an **observational study design**, not an experimental trial. - Researchers observe the effects of naturally occurring events or policy changes without any deliberate intervention or random assignment by the investigator. - Example: Comparing health outcomes before and after a public health policy change. *Risk factor trial* - This term is **not standard epidemiological terminology** for trial classification. - Trials are typically classified by design (randomized vs non-randomized) and control status (controlled vs uncontrolled), not by whether they study risk factors. - Most risk factor research uses observational cohort or case-control studies, not trials.
Question 7: What is the relative risk of developing tuberculosis among tobacco users as per the information given below?
- A. 2.67 (Correct Answer)
- B. 3.90
- C. 0.48
- D. 1.33
Explanation: **2.67** - To calculate the **relative risk**, we first need to determine the incidence Proportion (IP) of TB in tobacco users and non-tobacco users. - **IP for tobacco users** = (Number of tobacco users with TB) / (Total number of tobacco users) = 40/120 = 0.33. - **IP for non-tobacco users** = (Number of non-tobacco users with TB) / (Total number of non-tobacco users) = 10/80 = 0.125. - **Relative Risk** (RR) = IP of exposed / IP of unexposed = 0.33 / 0.125 = 2.67. *3.90* - This value would be obtained if there was an error in calculating the incidence proportions or the division. - For example, if the calculation for the incidence proportion of non-tobacco users was incorrect. *0.48* - A relative risk value less than 1 would indicate that tobacco use is a **protective factor** against tuberculosis, meaning tobacco users are less likely to develop TB than non-users, which is not the case here. - This value might be obtained by inverting the relative risk calculation (**IP unexposed / IP exposed**). *1.33* - This value is significantly lower than the correct relative risk and would likely result from a miscalculation in the number of cases or total populations for either group. - For instance, if the incidence rate for tobacco users was underestimated or for non-tobacco users was overestimated.
Question 8: What is the attributable risk percent (etiologic fraction) of tobacco for developing tuberculosis as per the information given below? Tobacco users Tuberculosis Total Present Absent Yes 40 80 120 No 10 70 80 Total 50 150 200
- A. 70.6%
- B. 50.5%
- C. 80.6%
- D. 62.5% (Correct Answer)
Explanation: ***62.5%*** - The **risk of TB in tobacco users** is 40/120 = 0.333 (33.3%). The **risk of TB in non-tobacco users** is 10/80 = 0.125 (12.5%). - The **attributable risk (AR)** is calculated as: Risk in exposed – Risk in unexposed = 0.333 - 0.125 = 0.208 - The **attributable risk percent (AR%)** or **etiologic fraction** is: [(Risk in exposed – Risk in unexposed) / Risk in exposed] × 100 - AR% = (0.208 / 0.333) × 100 = **62.5%** - This represents the **proportion of disease in the exposed group that can be attributed to the exposure** (tobacco use). *70.6%* - This value does not result from the correct attributable risk percent formula using the provided data. - This might arise from incorrectly calculating the population attributable risk or from computational errors. *50.5%* - This percentage does not result from the appropriate calculation of attributable risk percent. - This may result from calculation errors or misapplication of the formula components. *80.6%* - This value is inconsistent with the correct calculation based on the given data. - This could result from using incorrect ratios or misunderstanding which values belong in the formula.
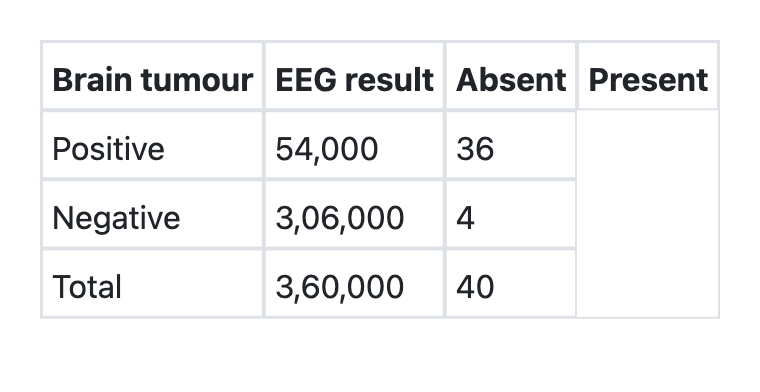
Question 9: What is the sensitivity of EEG for detecting brain tumours as per the information given below?
- A. 90% (Correct Answer)
- B. 99.99%
- C. 0.07%
- D. 85%
Explanation: ***90%*** - Sensitivity is calculated as **True Positives / (True Positives + False Negatives)**. - Based on the table provided, among patients with brain tumors (disease positive), 36 cases were correctly identified by EEG and 4 cases were missed. - Sensitivity = 36/(36+4) = 36/40 = 0.9 or **90%**. - This indicates that the EEG test correctly identifies 90% of patients who actually have brain tumors. - High sensitivity is important for screening tests to minimize false negatives. *99.99%* - This extremely high percentage is incorrect and not supported by the data. - It would indicate near-perfect detection of all brain tumor cases, which contradicts the table showing 4 missed cases out of 40. - Results from miscalculation or misinterpretation of the sensitivity formula. *0.07%* - This extremely low value represents a fundamental calculation error. - Such low sensitivity would indicate the test is essentially useless for detecting brain tumors. - Does not correspond to any reasonable interpretation of the given data. *85%* - While close to the correct answer, this is mathematically incorrect. - Likely results from calculation error or rounding mistakes. - The correct calculation (36/40) yields exactly 90%, not 85%.
Pediatrics
1 questionsFlattening of the growth curve in the growth chart signifies:
UPSC-CMS 2018 - Pediatrics UPSC-CMS Practice Questions and MCQs
Question 1: Flattening of the growth curve in the growth chart signifies:
- A. Child does not need special care
- B. Child is severely malnourished
- C. Child is showing signs of growth failure (Correct Answer)
- D. Child is on a healthy path
Explanation: ***Child is showing signs of growth failure*** - A **flattening growth curve** indicates a deviation from the expected growth pattern, implying that the child is not growing at a healthy rate. - This pattern is a crucial visual cue on a growth chart that suggests **potential underlying health or nutritional issues** warranting further investigation. *Child does not need special care* - A flattening growth curve is a **red flag** that signifies growth faltering, meaning the child likely *does* need special care or intervention. - It suggests that the child's growth has **stalled or slowed significantly**, deviating from their usual percentile channel. *Child is severely malnourished* - While **severe malnutrition** can lead to a flattening growth curve, it is not the *only* cause; growth failure can stem from various factors, including chronic illness, inadequate caloric intake, or absorption problems. - A flattened curve indicates *growth failure*, which is a broader term, and further assessment is needed to determine if it has progressed to **severe malnutrition**. *Child is on a healthy path* - A **healthy growth path** is characterized by continued growth along a consistent percentile curve, or within a specific range, over time. - A flattening curve indicates a **departure from this healthy trajectory**, suggesting an issue that requires attention rather than a normal developmental course.
About UPSC-CMS 2018 Questions
This page contains 119 questions from the UPSC-CMS 2018 paper, organised across 14 subjects for focused practice. Every question comes with the correct answer and a detailed explanation to help you understand the underlying concept. Subject-wise organisation lets you target specific areas and identify which topics carried the most weight in this particular year.
Practising year-wise papers is essential for understanding how the UPSC-CMS exam evolves — you can spot trending topics, gauge difficulty shifts, and benchmark your readiness against a real paper. To take your preparation further, download the Oncourse app for AI-driven performance insights, spaced repetition of questions you got wrong, and a personalised study plan built around your UPSC-CMS goals.