Question 11: 
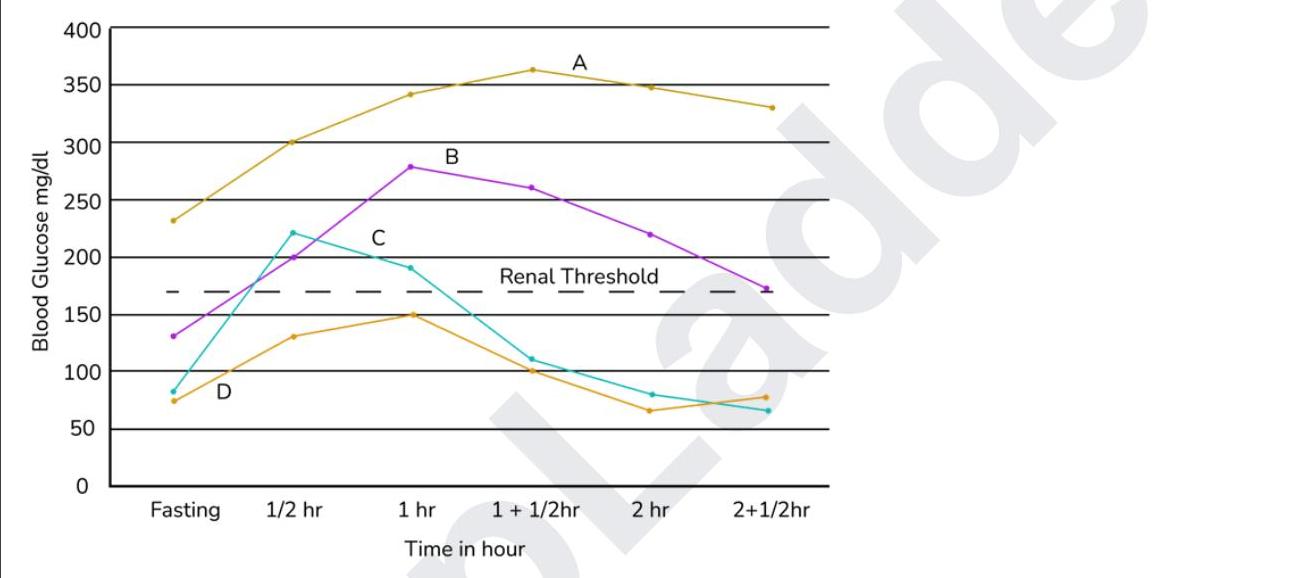
Which of the following represents a normal response to an OGTT?
- A. Graph A
- B. Graph B
- C. Graph D (Correct Answer)
- D. Graph C
Explanation: ***Graph D***
- Graph D shows a **fasting glucose level** below 100 mg/dL, a peak below the renal threshold around 1 hour, and a return to baseline or below within 2-2.5 hours. This pattern is characteristic of normal glucose regulation.
- A healthy individual can efficiently clear the glucose load from circulation, preventing sustained hyperglycemia.
*Graph A*
- Graph A shows significantly **elevated fasting glucose levels** (above 200 mg/dL) and a sustained, very high blood glucose response, peaking above 350 mg/dL and remaining well above the renal threshold.
- This pattern is indicative of **diabetes mellitus**, where insulin production or sensitivity is severely impaired.
*Graph B*
- Graph B displays a high fasting glucose level (above 125 mg/dL) and a blood glucose curve that peaks very high (above 250 mg/dL), staying significantly above the renal threshold even at 2.5 hours.
- This profile is suggestive of **impaired glucose tolerance** or **diabetes mellitus**, as the body struggles to effectively lower blood glucose after the glucose load.
*Graph C*
- Graph C shows a normal fasting glucose level but an **extremely rapid and high peak** much earlier than usual, followed by a precipitous drop below normal fasting levels after 1.5 hours, indicating **reactive hypoglycemia**.
- This rapid rise and fall, with a nadir below fasting levels, is not a normal response and may be seen in conditions like **dumping syndrome** or early-stage diabetes with a delayed insulin response.