

GFR Assessment - Kidney's Filter Check
Glomerular Filtration Rate (GFR): Key kidney function index. Normal: 90-120 mL/min/1.73m².
- Ideal Marker (e.g., Inulin): Freely filtered, not reabsorbed/secreted/metabolized.
- Inulin Clearance (Gold Standard): $C_{Inulin} = (U_{Inulin} \times V) / P_{Inulin}$.
- Endogenous Markers:
- Creatinine: Common. Measured Creatinine Clearance ($C_{Cr}$) uses 24hr urine: $C_{Cr} = (U_{Cr} \times V) / P_{Cr}$.
- Overestimates GFR (tubular secretion).
- Affected by muscle, diet, drugs (cimetidine, trimethoprim block secretion).
- Cystatin C: Less affected by muscle/diet; good for specific groups (elderly, children, amputees).
- Urea (BUN): Unreliable for GFR (reabsorbed; varies with hydration, protein intake).
- Creatinine: Common. Measured Creatinine Clearance ($C_{Cr}$) uses 24hr urine: $C_{Cr} = (U_{Cr} \times V) / P_{Cr}$.
- eGFR Equations (from serum markers):
- Cockcroft-Gault: $eC_{Cr} = ((140 - \text{age}) \times \text{Wt kg}) / (72 \times S_{Cr}) \times (0.85 \text{ if F})$. Used for drug dosing.
- MDRD & CKD-EPI (preferred for GFR): More accurate. CKD-EPI better if GFR > 60 mL/min/1.73m².
- Uses: Detect/monitor kidney disease, CKD staging, drug dose adjustment.

⭐ Creatinine clearance (measured) slightly overestimates true GFR because creatinine is actively secreted by the proximal tubules (approx. 10-20%).
Tubular Function - Tiny Tubes' Tasks
- Concentration Ability: Kidney's water conservation.
- Urine Osmolality: Normal range 50-1200 mOsm/kg. Best indicator.
- Urine Specific Gravity (USG): Normal range 1.003-1.030. Less accurate.
- Water Deprivation Test: Differentiates Diabetes Insipidus (DI) types.
Loading diagram…
- Dilution Ability: Kidney's excess water excretion.
- Water Load Test: Urine osmolality should fall to < 100 mOsm/kg.
- Acidification: Distal tubule H+ secretion.
- Urine pH: Normal 4.5-8.0.
- NH4Cl Loading Test: Diagnoses RTA.
- Reabsorption & Secretion:
- Fractional Excretion of Sodium ($FE_{Na}$): $FE_{Na} = \frac{(U_{Na} \times P_{Cr})}{(P_{Na} \times U_{Cr})} \times 100$.
⭐ $FE_{Na}$ < 1% suggests pre-renal azotemia; > 2% suggests Acute Tubular Necrosis (ATN).
- Tubular Maximum for Glucose ($Tm_G$): Renal plasma threshold for glucose approx. 180-200 mg/dL.
- Fractional Excretion of Sodium ($FE_{Na}$): $FE_{Na} = \frac{(U_{Na} \times P_{Cr})}{(P_{Na} \times U_{Cr})} \times 100$.
Urine & Blood Analysis - Fluid Clues Unveiled
Blood Markers:
- S. Creatinine: Normal 0.6-1.2 mg/dL. ↑ indicates ↓ GFR.
- BUN: Normal 7-20 mg/dL. ↑ in renal failure, dehydration.
- BUN/Cr Ratio: Normal 10:1-20:1.
-
20:1: Pre-renal (e.g., dehydration).
- <10:1: Intra-renal (e.g., ATN) / ↓ protein intake.
-
Urine Analysis Highlights:
- Specific Gravity (SG): 1.005-1.030. Fixed 1.010 in CRF (loss of concentration).
- Proteinuria: <150 mg/day. Microalbuminuria 30-300 mg/day. Nephrotic >3.5 g/day.
- Glucosuria: If blood glucose >180-200 mg/dL.
- Hematuria: RBCs; glomerular vs. non-glomerular origin.
Key Urine Casts & Significance:
| Cast Type | Significance |
|---|---|
| Hyaline | Normal, dehydration |
| RBC | Glomerulonephritis |
| WBC | Pyelonephritis, AIN (Acute Interstitial Nephritis) |
| Granular (Muddy Brown) | Acute Tubular Necrosis (ATN) |
| Waxy (Broad) | Chronic Renal Failure (CRF) |
| Fatty | Nephrotic syndrome (Maltese cross appearance) |
| %%{init: {'flowchart': {'htmlLabels': true}}}%% | |
| flowchart TD |
Start["🔬 BUN/Cr Ratio Analysis
• Assess kidney state• Check urea levels"]
D1{"📋 Ratio > 20:1?
• High BUN/Cr ratio• Evaluate flow"}
D2{"📋 Ratio < 10:1?
• Low BUN/Cr ratio• Check reabsorption"}
PreRenal["🩺 Pre-renal Azotemia
• Urea ⬆️ reabsorption• E.g. dehydration"]
IntraRenal["🩺 Intra-renal Azotemia
• ATN / Low protein• Tubule damage"]
Normal["✅ Normal or Post-renal
• Ratio 10-20:1• Consider context"]
Start --> D1 D1 -->|Yes| PreRenal D1 -->|No| D2 D2 -->|Yes| IntraRenal D2 -->|No| Normal
style Start fill:#FFF7ED, stroke:#FFEED5, stroke-width:1.5px, rx:12, ry:12, color:#C2410C style D1 fill:#FEF8EC, stroke:#FBECCA, stroke-width:1.5px, rx:12, ry:12, color:#854D0E style D2 fill:#FEF8EC, stroke:#FBECCA, stroke-width:1.5px, rx:12, ry:12, color:#854D0E style PreRenal fill:#F7F5FD, stroke:#F0EDFA, stroke-width:1.5px, rx:12, ry:12, color:#6B21A8 style IntraRenal fill:#F7F5FD, stroke:#F0EDFA, stroke-width:1.5px, rx:12, ry:12, color:#6B21A8 style Normal fill:#F6F5F5, stroke:#E7E6E6, stroke-width:1.5px, rx:12, ry:12, color:#525252
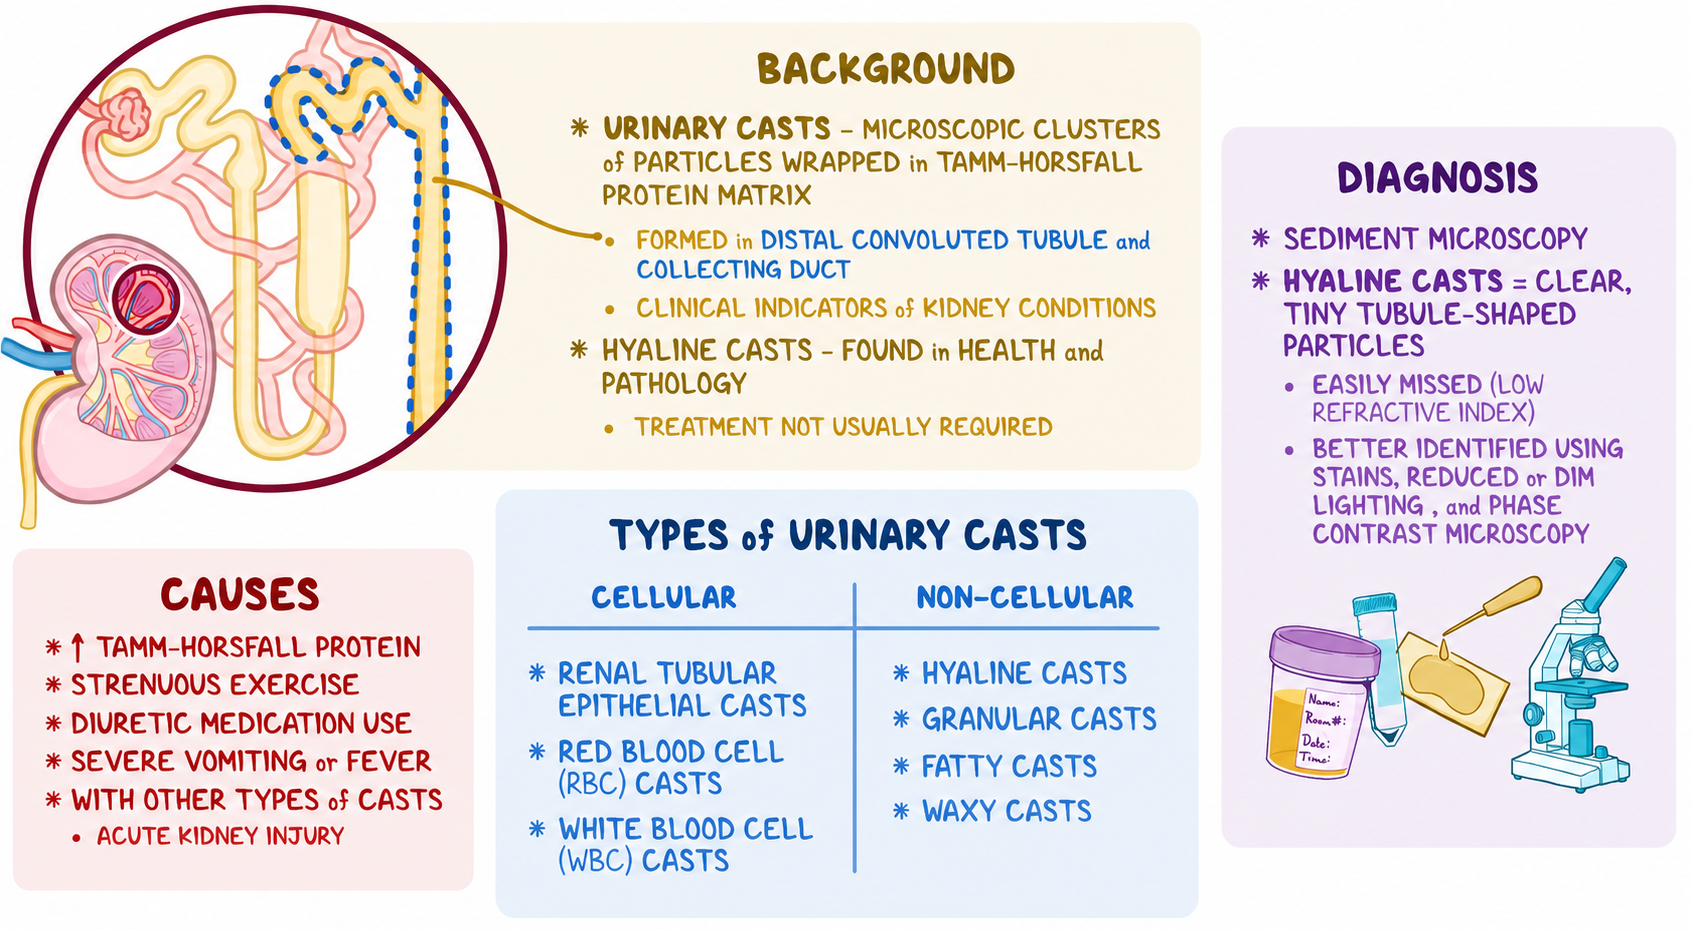
> ⭐ Muddy brown (granular) casts in urine sediment are pathognomonic for Acute Tubular Necrosis (ATN).
## RPF & FF - Flow & Filter Facts
* **Renal Plasma Flow (RPF)**:
- Volume of plasma perfusing kidneys per minute.
- Best measured by PAH clearance: $RPF = (U_{PAH} \times V) / P_{PAH}$.
- Normal RPF: **~600 mL/min** (Effective RPF).
* **Filtration Fraction (FF)**:
- Proportion of RPF filtered into Bowman's space.
- Calculated as: $FF = GFR / RPF$.
- Normal FF: **~20%** (0.16-0.20).
* **Clinical Interpretation**:
- Changes in RPF & FF reflect renal hemodynamics.
> ⭐ ↑FF (GFR maintained despite ↓RPF) suggests efferent arteriolar constriction (e.g., renal artery stenosis, early heart failure).
- ↓FF with ↓GFR & ↓RPF suggests afferent constriction or severe hypoperfusion (e.g., NSAIDs, shock).
```mermaid
%%{init: {'flowchart': {'htmlLabels': true}}}%%
flowchart TD
Start["<b>🧪 Key Patterns</b><br><span style='display:block; text-align:left; color:#555'>• GFR/RPF/FF</span><span style='display:block; text-align:left; color:#555'>• Renal Hemodynamics</span>"]
%% Row 1
R1_Pattern["<b>📉 Low Flow</b><br><span style='display:block; text-align:left; color:#555'>• ⬇️ RPF </span><span style='display:block; text-align:left; color:#555'>• GFR ~normal</span>"]
R1_FF["<b>⬆️ Filtration Fraction</b><br><span style='display:block; text-align:left; color:#555'>• FF = GFR / RPF</span><span style='display:block; text-align:left; color:#555'>• ⬆️ FF calculated</span>"]
R1_Diag["<b>🩺 Efferent Constrict</b><br><span style='display:block; text-align:left; color:#555'>• RAS activity</span><span style='display:block; text-align:left; color:#555'>• Early CHF</span>"]
%% Row 2
R2_Pattern["<b>📉 Severe Low Flow</b><br><span style='display:block; text-align:left; color:#555'>• ⬇️⬇️ RPF</span><span style='display:block; text-align:left; color:#555'>• ⬇️⬇️ GFR</span>"]
R2_FF["<b>⬇️/N Filtration Fraction</b><br><span style='display:block; text-align:left; color:#555'>• ⬇️ or Normal FF</span><span style='display:block; text-align:left; color:#555'>• Proportional drop</span>"]
R2_Diag["<b>🩺 Afferent Constrict</b><br><span style='display:block; text-align:left; color:#555'>• NSAIDs or Shock</span><span style='display:block; text-align:left; color:#555'>• Hypoperfusion</span>"]
%% Row 3
R3_Pattern["<b>📈 High Flow</b><br><span style='display:block; text-align:left; color:#555'>• ⬆️ RPF</span><span style='display:block; text-align:left; color:#555'>• ⬆️ GFR</span>"]
R3_FF["<b>N/⬆️ Filtration Fraction</b><br><span style='display:block; text-align:left; color:#555'>• Normal or ⬆️ FF</span><span style='display:block; text-align:left; color:#555'>• Vasodilation</span>"]
R3_Diag["<b>🩺 Hyperfiltration</b><br><span style='display:block; text-align:left; color:#555'>• Pregnancy</span><span style='display:block; text-align:left; color:#555'>• Early Diabetes</span>"]
%% Row 4
R4_Pattern["<b>📉 Reduced GFR</b><br><span style='display:block; text-align:left; color:#555'>• N/⬇️ RPF</span><span style='display:block; text-align:left; color:#555'>• ⬇️ GFR</span>"]
R4_FF["<b>⬇️ Filtration Fraction</b><br><span style='display:block; text-align:left; color:#555'>• ⬇️ FF pattern</span><span style='display:block; text-align:left; color:#555'>• Efferent dilation</span>"]
R4_Diag["<b>🩺 Medicine Effect</b><br><span style='display:block; text-align:left; color:#555'>• ACEi/ARB use</span><span style='display:block; text-align:left; color:#555'>• AngII dependent</span>"]
Start --> R1_Pattern
Start --> R2_Pattern
Start --> R3_Pattern
Start --> R4_Pattern
R1_Pattern --> R1_FF --> R1_Diag
R2_Pattern --> R2_FF --> R2_Diag
R3_Pattern --> R3_FF --> R3_Diag
R4_Pattern --> R4_FF --> R4_Diag
style Start fill:#F6F5F5, stroke:#E7E6E6, stroke-width:1.5px, rx:12, ry:12, color:#525252
style R1_Pattern fill:#FEF8EC, stroke:#FBECCA, stroke-width:1.5px, rx:12, ry:12, color:#854D0E
style R1_FF fill:#FFF7ED, stroke:#FFEED5, stroke-width:1.5px, rx:12, ry:12, color:#C2410C
style R1_Diag fill:#F7F5FD, stroke:#F0EDFA, stroke-width:1.5px, rx:12, ry:12, color:#6B21A8
style R2_Pattern fill:#FEF8EC, stroke:#FBECCA, stroke-width:1.5px, rx:12, ry:12, color:#854D0E
style R2_FF fill:#FFF7ED, stroke:#FFEED5, stroke-width:1.5px, rx:12, ry:12, color:#C2410C
style R2_Diag fill:#F7F5FD, stroke:#F0EDFA, stroke-width:1.5px, rx:12, ry:12, color:#6B21A8
style R3_Pattern fill:#FEF8EC, stroke:#FBECCA, stroke-width:1.5px, rx:12, ry:12, color:#854D0E
style R3_FF fill:#FFF7ED, stroke:#FFEED5, stroke-width:1.5px, rx:12, ry:12, color:#C2410C
style R3_Diag fill:#F7F5FD, stroke:#F0EDFA, stroke-width:1.5px, rx:12, ry:12, color:#6B21A8
style R4_Pattern fill:#FEF8EC, stroke:#FBECCA, stroke-width:1.5px, rx:12, ry:12, color:#854D0E
style R4_FF fill:#FFF7ED, stroke:#FFEED5, stroke-width:1.5px, rx:12, ry:12, color:#C2410C
style R4_Diag fill:#F7F5FD, stroke:#F0EDFA, stroke-width:1.5px, rx:12, ry:12, color:#6B21A8
High‑Yield Points - ⚡ Biggest Takeaways
- GFR is the best kidney function indicator; Creatinine Clearance (CrCl) is its common clinical estimate.
- Inulin clearance is the gold standard for GFR measurement, but not routinely used.
- Serum creatinine is inversely related to GFR and influenced by muscle mass.
- BUN/Creatinine ratio >20:1 strongly suggests pre-renal azotemia.
- FENa <1% indicates pre-renal AKI; >2% suggests Acute Tubular Necrosis (ATN).
- Urine specific gravity & osmolality assess renal concentrating ability.
Unlock the full lesson and continue reading
Signup to continue reading this lesson and unlimited access questions, flashcards, AI notes, and more