
Collection and Presentation of Data — Flashcards

The horizontal line on either side of rectangles in the Forest plot represent _____
Values such as rank orders, or mild-moderate-severe represent _____ scale data
_____ that involves combining results from multiple studies on a given topic.
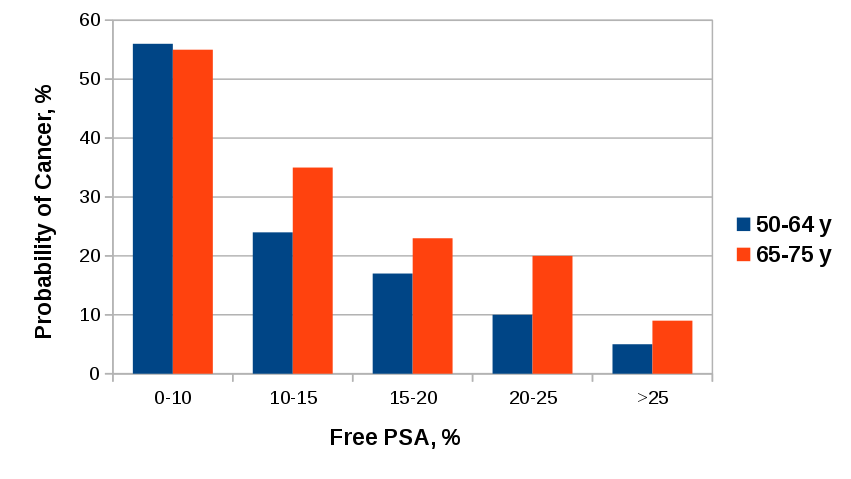
Bar graphs can be used for representing _____ scale data that forms discrete categories
The confidence interval is smaller with a _____ sample size.
Histograms can be used for representing _____ scale data that forms continuous categories
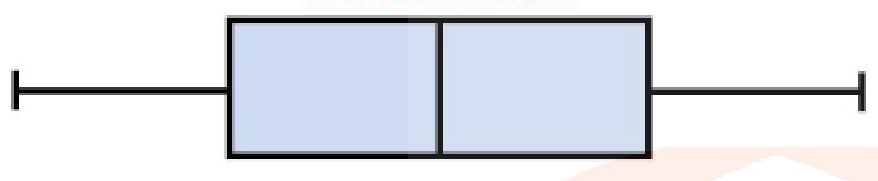
What type of distribution is this? _____
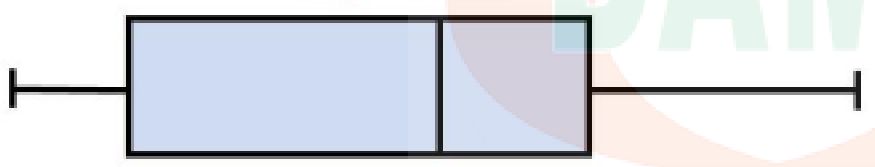
What type of distribution is this? _____
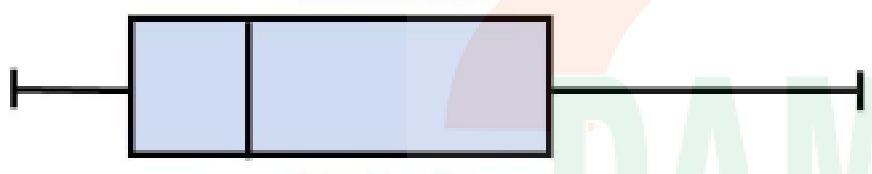
What type of distribution is this? _____
What type of bar graph is represented below? _____
Collection and Presentation of Data Flashcards for NEET-PG
Study 10 flashcards on Collection and Presentation of Data for NEET-PG Community Medicine. These active recall cards cover the key concepts, clinical associations, and high-yield facts from this chapter of Biostatistics. Each card is designed to test your understanding rather than just recognition, building stronger and more durable memories for exam day.
For personalised spaced repetition scheduling and unlimited flashcards, download the Oncourse app.
Frequently Asked Questions
Are Collection and Presentation of Data flashcards free?
How many flashcards does this chapter have?
How should I use these flashcards for NEET-PG?
Are there more flashcards for Biostatistics?
Want unlimited flashcards?
Get full access to all flashcards, spaced repetition, and progress tracking.
Scan to download app