
Biostatistics — Flashcards

On this page
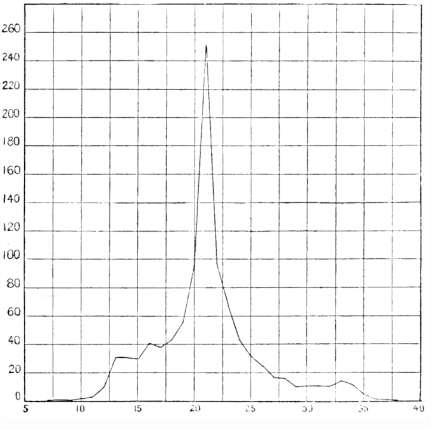
What type of distribution is this? _____

What type of distribution is this? _____

What type of distribution is this? _____

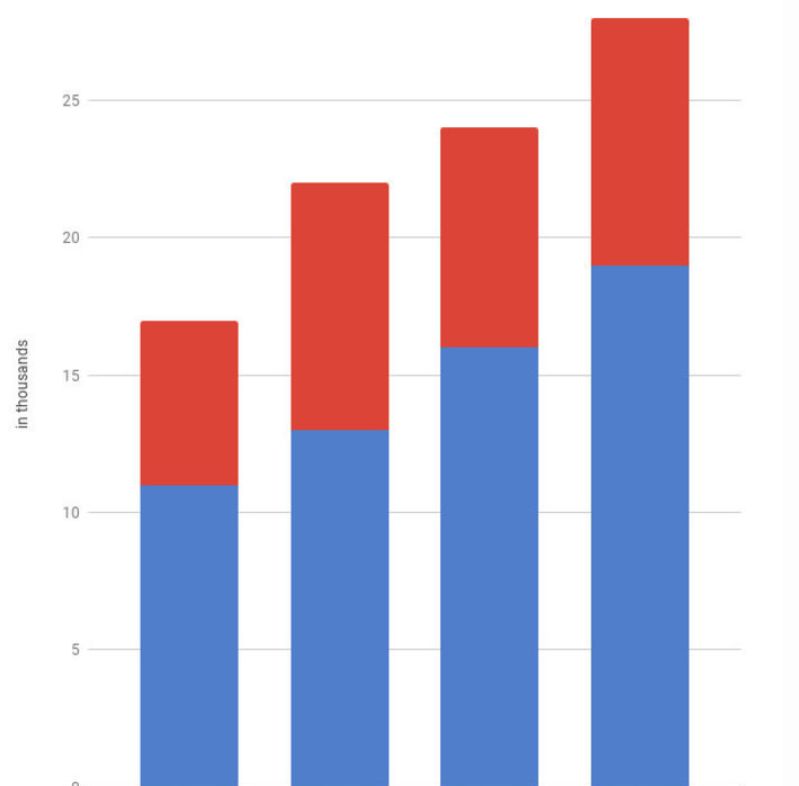
What type of bar graph is represented below? _____
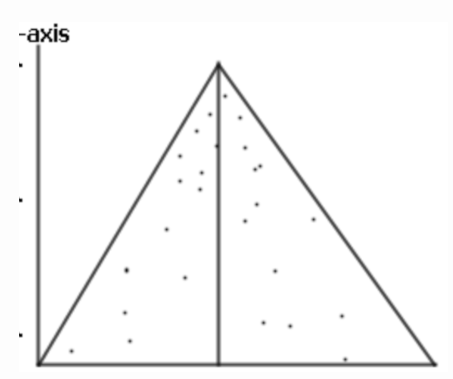
The given image is of a _____.
The given image shows a _____ plot
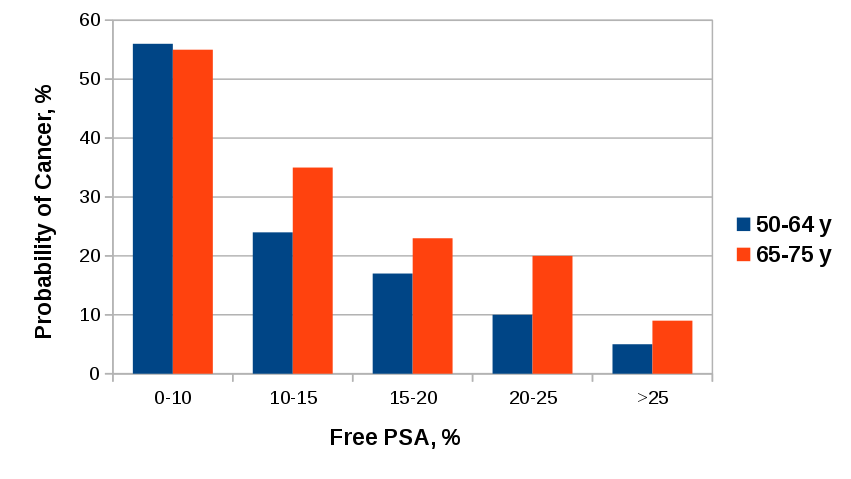
What type of bar graph is represented below? _____
test of significance for normalcy of data is _____ test
non-parametric test of significance is done for _____ and _____ data
_____ is the probability that when the test is negative, the disease is absent
Study by Chapter
Collection and Presentation of Data
Flashcards
Measures of Central Tendency
Flashcards
Measures of Dispersion
Flashcards
Normal Distribution
Flashcards
Sampling Methods
Flashcards
Sample Size Calculation
Flashcards
Hypothesis Testing
Flashcards
Tests of Significance
Flashcards
Correlation and Regression
Flashcards
Survival Analysis
Flashcards
Multivariate Analysis
Flashcards
Statistical Software in Research
Flashcards
About Biostatistics Flashcards for NEET-PG
These Biostatistics flashcards are designed for NEET-PG Community Medicine preparation, using active recall to help you retain high-yield concepts, clinical correlations, and commonly tested facts. Each card prompts you to retrieve information from memory rather than passively reviewing notes, which research shows leads to significantly better exam performance.
The 196 cards in this deck cover the most important topics in Biostatistics, including key mechanisms, diagnostic criteria, treatment protocols, and clinical pearls that frequently appear in NEET-PG examinations. Cards are organised by chapter so you can focus on specific areas or work through the entire topic systematically.
For personalised spaced repetition scheduling that adapts to your performance, unlimited flashcards, and detailed progress analytics, download the Oncourse app.
Frequently Asked Questions
Are Biostatistics flashcards free on Oncourse?
How do flashcards help with NEET-PG preparation?
How many Biostatistics flashcards are available?
Can I study Biostatistics flashcards by chapter?
What topics do these Community Medicine flashcards cover?
Want unlimited flashcards?
Get full access to all flashcards, spaced repetition, and progress tracking.
Start For Free