Sensitivity vs specificity: 2x2 table, calculations and clinical application
Ah, the classic 2x2 table! This is the bread and butter of biostatistics for the USMLE. Understanding the difference between sensitivity and specificity is basically a rite of passage for every med student.
Let's start by laying out the foundation with the standard 2x2 table that relates test results to the actual disease state.
| Disease Present (D+) | Disease Absent (D-) | |
|---|---|---|
| Test Positive (T+) | True Positive (TP) | False Positive (FP) |
| Test Negative (T-) | False Negative (FN) | True Negative (TN) |
Now that we have our table, we can calculate how well a test performs.
Sensitivity is the "True Positive Rate"—it tells us how good the test is at picking up people who actually have the disease. Specificity, on the other hand, is the "True Negative Rate"—it tells us how good the test is at correctly identifying people who are healthy.
Here are the formulas you'll need to memorize:
\text{Sensitivity} = \frac{TP}{TP + FN} \ \text{Specificity} = \frac{TN}{TN + FP}
When it comes to clinical practice, we use these metrics to decide which test to order. A high-sensitivity test is great for screening, while a high-specificity test is what you want for confirming a diagnosis.
Mnemonic: SNOUT & SPIN
- SeNsitivity rules OUT (SNOUT): A negative result on a highly sensitive test means you almost certainly don't have the disease.
- SPecificity rules IN (SPIN): A positive result on a highly specific test means you almost certainly do have the disease.
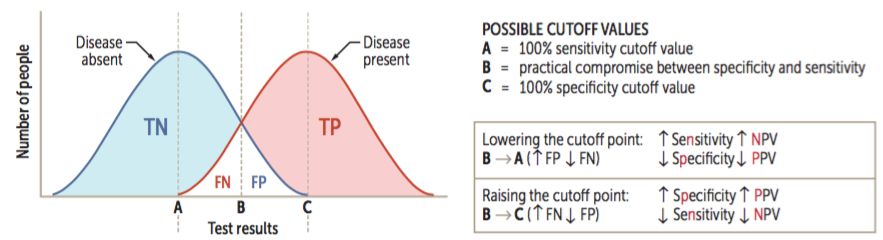
To help you visualize how these overlap and where the "cut-off" points usually lie, let me find a diagram for you.
This diagram is a classic for understanding how shifting the "cut-off" point for a test affects its performance.
If you move the cut-off to the left (Point A), you catch everyone with the disease (100% sensitivity), but you also pick up a lot of healthy people (false positives). If you move it to the right (Point C), you're very sure that anyone who tests positive actually has the disease (100% specificity), but you'll miss some sick people (false negatives).
This is a high-yield topic that shows up in almost every USMLE Step 1 and Step 2 CK exam. Once you've got the 2x2 table down, you're halfway there!
Would you like to test your knowledge with a quick game of Synapses to see if you can group these concepts correctly? Or maybe you'd like to see some flashcards to lock these formulas in?
Setting up chat...