Number needed to treat and number needed to harm: calculation and interpretation
Ah, biostatistics! The bread and butter of USMLE Step 1 and Step 2 CK. Understanding NNT and NNH is basically like learning the "value for money" of a medical intervention.
Let's break down the math and the logic behind these two concepts.
1. Number Needed to Treat (NNT)
NNT tells you how many patients you need to treat with a specific intervention to prevent one additional bad outcome (like a heart attack or death) compared to a control group.
- The Formula:
NNT = 1 / ARR - Absolute Risk Reduction (ARR): This is the difference in the rate of bad outcomes between the control group and the treatment group.
ARR = [Control Event Rate (CER)] - [Experimental Event Rate (EER)]
- Interpretation: In an ideal world, NNT would be 1 (every person you treat is saved). Generally, the lower the NNT, the more effective the treatment.
2. Number Needed to Harm (NNH)
NNH is the flip side. it tells you how many patients need to be exposed to a treatment or risk factor before one additional person experiences an adverse event (a side effect or complication).
- The Formula:
NNH = 1 / ARI - Absolute Risk Increase (ARI): This is the difference in the rate of bad outcomes between the treatment group and the control group.
ARI = [Experimental Event Rate (EER)] - [Control Event Rate (CER)]
- Interpretation: You want this number to be as high as possible. A high NNH means the side effect is rare.
I've put together a quick comparison table to help you keep these straight during your prep.
| Feature | Number Needed to Treat (NNT) | Number Needed to Harm (NNH) |
|---|---|---|
| Goal | Prevent 1 bad outcome | Cause 1 bad outcome (adverse event) |
| Formula | 1 / ARR | 1 / ARI |
| Ideal Value | Low (closer to 1) | High (approaching infinity) |
| Clinical Meaning | Effectiveness of the drug | Safety/Toxicity of the drug |
| Calculation Tip | Always round UP to the nearest whole number | Always round DOWN to the nearest whole number |
That table should help you keep the formulas straight. One thing to remember for the exam: if your calculation gives you a decimal (like 12.3), you always round up for NNT (because you can't treat 0.3 of a person) and round down for NNH (to be conservative about safety).
Let me find some high-yield lessons that dive deeper into these biostatistics concepts for you.
📚 NNT and NNH Lessons
Those lessons will definitely help you master the calculation and interpretation of these concepts.
I'll also see if I can find a helpful diagram to visualize how NNT and NNH are derived from absolute risk.
I found a great visual that shows how NNT and NNH relate to relative risk and baseline risk. This is a slightly more advanced way to think about it, but it's very helpful for understanding how the baseline risk of a population affects the final number.
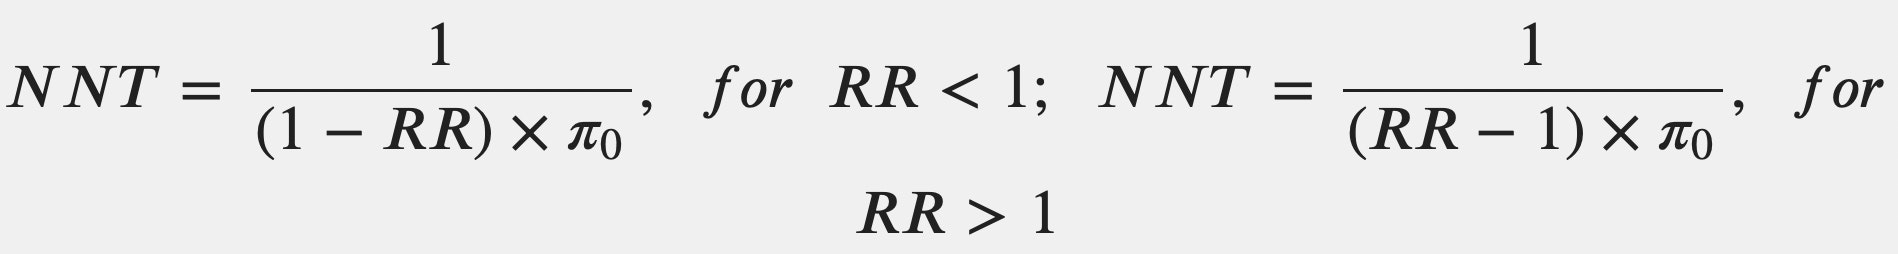
That diagram shows how NNT and NNH are calculated using Relative Risk (RR) and the baseline risk of the population. It's a great way to see how the same drug can have different NNTs depending on who you're treating!
If you're feeling confident with the math, I can pull up some practice questions to see how this looks in a clinical scenario. Just let me know!
Setting up chat...