Clinical biochemistry: liver function tests, renal function tests interpretation
Ah, the bread and butter of clinical biochemistry! Mastering the interpretation of Liver Function Tests (LFTs) and Renal Function Tests (RFTs) is like learning to read the body's internal dashboard. It's super high-yield for your exams and even more important when you're on the wards.
Let me pull up some of the best lessons we have on these topics to give you a solid foundation.
📚 LFT and RFT Lessons
When we look at Liver Function Tests (LFTs), we're actually looking at three different things: markers of liver cell injury, markers of bile flow (cholestasis), and markers of how well the liver is actually working (synthetic function).
- Hepatocellular Injury: Look at ALT and AST. ==ALT is more specific to the liver==, while AST can also come from heart or muscle. If these are in the thousands, think viral hepatitis or toxins (like paracetamol).
- Cholestasis: Look at ALP and GGT. If both are high, the problem is likely the biliary tree. If only ALP is high, it could be coming from bone!
- Synthetic Function: This is the "true" test of function. Check Albumin (chronic) and PT/INR (acute). Since the liver makes clotting factors, a rising INR is a big red flag for acute liver failure.
I'm going to find a handy comparison table to help you differentiate these patterns at a glance.
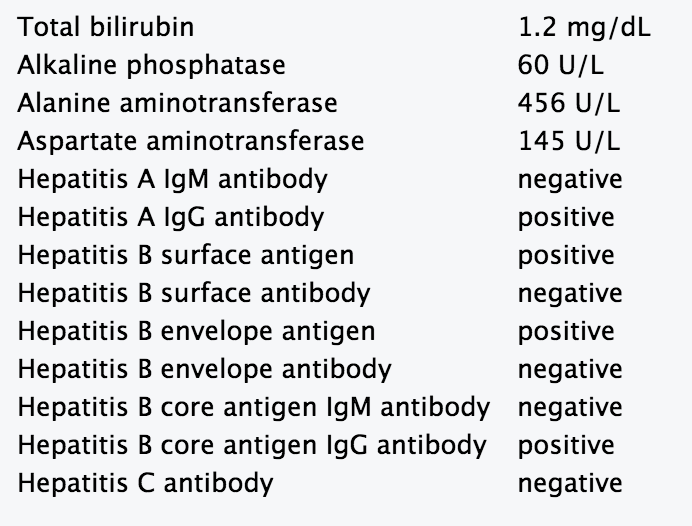
Here is a clinical example of how these markers look in a real lab report, specifically focusing on a hepatocellular pattern where the transaminases (ALT/AST) are significantly elevated.
Now, let's shift gears to the Renal Function Tests (RFTs). These tell us how well the kidneys are filtering waste and maintaining fluid balance.
- Glomerular Filtration Rate (GFR): This is the ==gold standard== for overall kidney function. We usually estimate it (eGFR) using formulas like MDRD or CKD-EPI.
- Serum Creatinine: A byproduct of muscle breakdown. It's reliable but remember: it depends on muscle mass! A bodybuilder and a frail elderly person will have very different "normal" creatinine levels.
- Blood Urea Nitrogen (BUN): Urea is the end product of protein metabolism. It's less specific than creatinine because it can rise due to high protein diets, GI bleeds, or dehydration.
- BUN:Creatinine Ratio: This is a classic exam favorite!
- > 20:1: Suggests Pre-renal causes (like dehydration or heart failure). The kidney is fine, but it's not getting enough blood.
- 10-15:1: Suggests Intrinsic renal damage (like Acute Tubular Necrosis).
Let me find a clear flowchart or table that breaks down these RFT patterns for you.
To help you stage kidney injury based on these lab values, here is a comparison of the KDIGO and pRIFLE criteria, which are the standard ways we classify Acute Kidney Injury (AKI) in clinical practice.
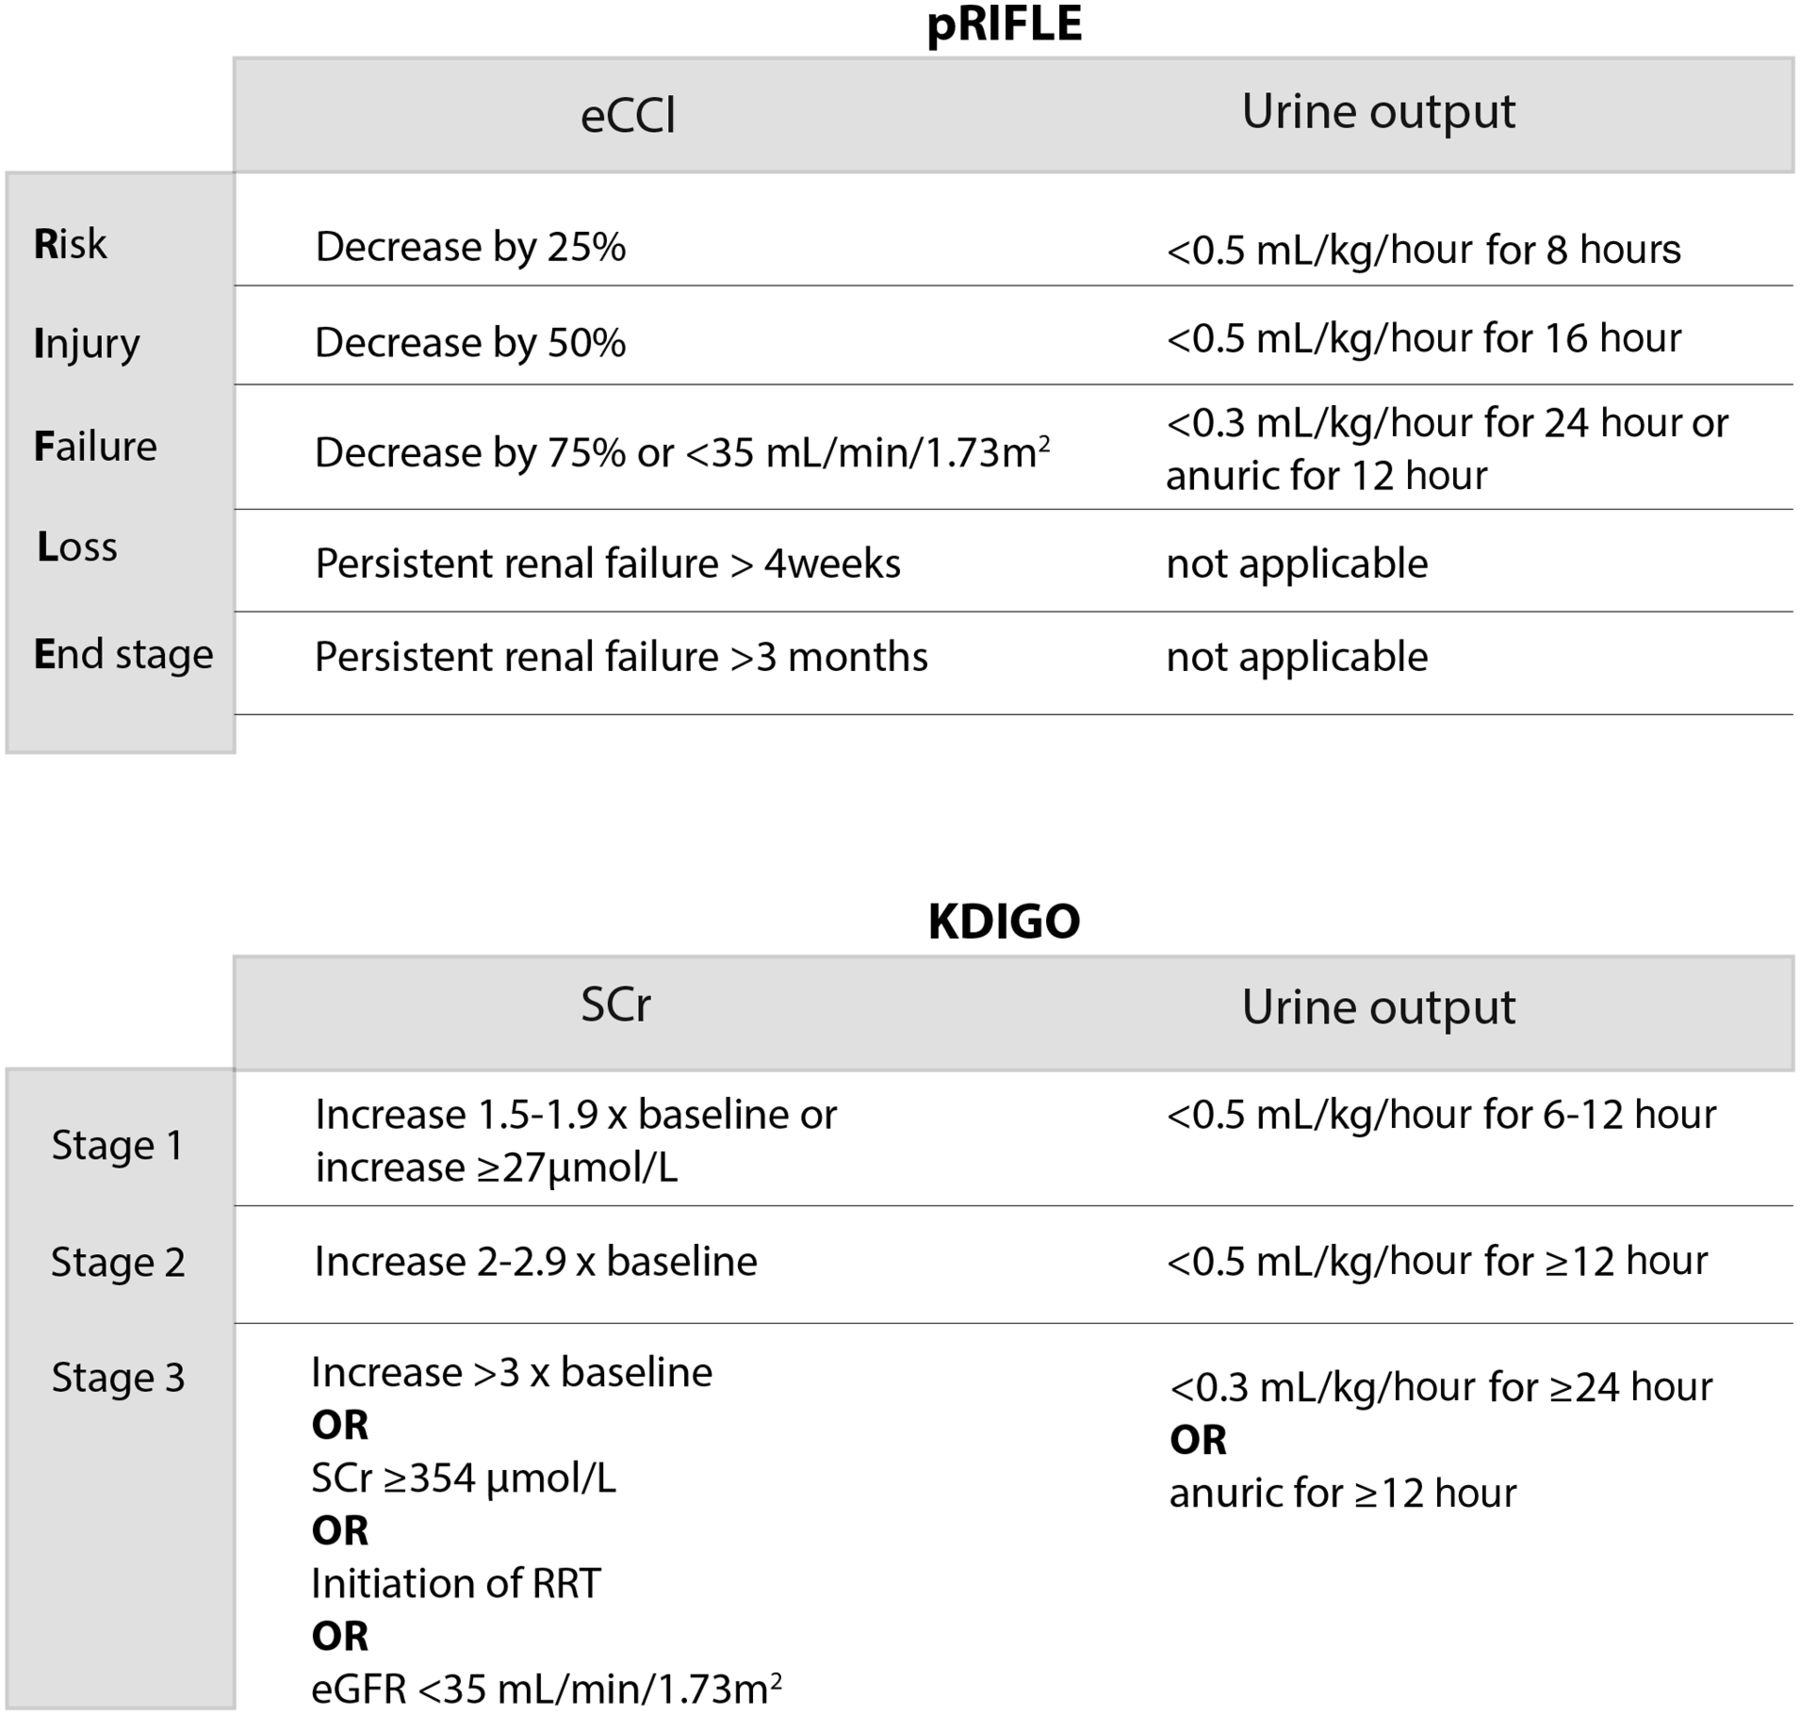
These tables are absolute gold for your exams—especially the KDIGO criteria, as they're frequently tested in clinical scenarios.
Since LFT and RFT patterns can sometimes get mixed up when you're under pressure, would you like to try a quick word-grouping game to see if you can correctly categorize different lab findings into their respective patterns? It's a great way to lock this in!
Setting up chat...