Cardiac cycle: phases, heart sounds and pressure-volume loops
The cardiac cycle is like the choreography of the heart—everything has to happen in a specific order for the blood to keep moving! It's one of those foundational topics that shows up everywhere in the USMLE, from physiology to pathology.
To get us started, I'm going to pull up a classic visual that ties the pressures, volumes, and heart sounds all together.
That Wiggers diagram is the "holy grail" of cardiac physiology, but to really nail the USMLE questions on contractility and preload, we also need to look at the Pressure-Volume (PV) loop. Let me grab a clear diagram of that for you as well.
Here are the two most important diagrams for mastering the cardiac cycle. The Wiggers diagram shows how everything happens over time, while the PV loop shows how pressure and volume interact in a single beat.
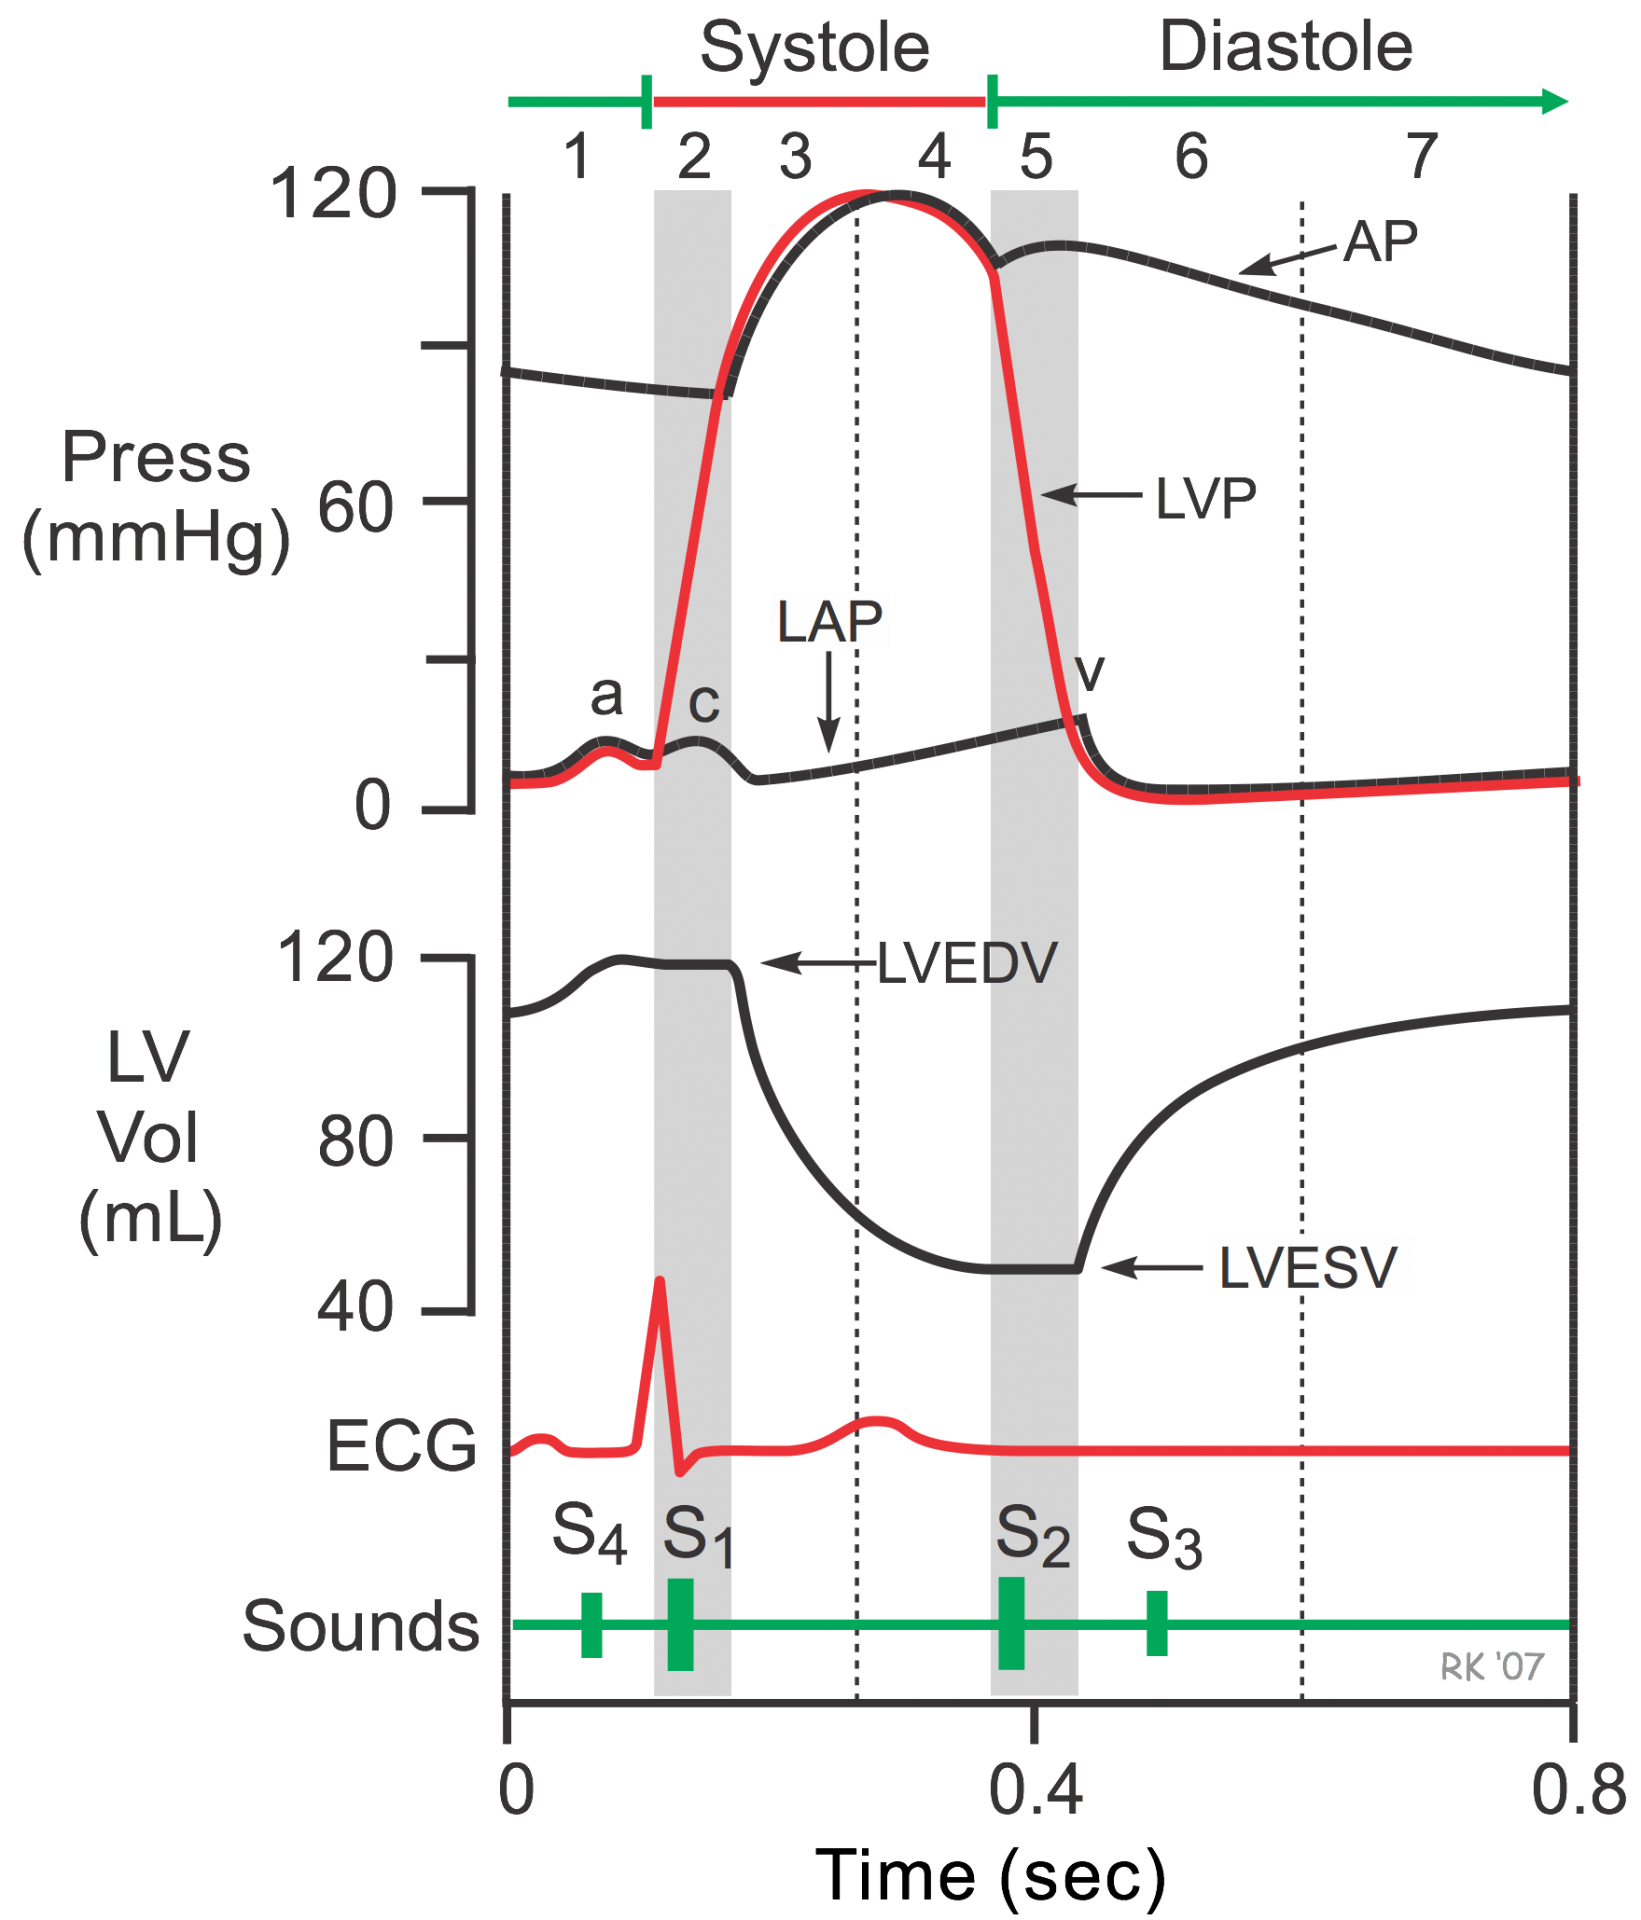
This Wiggers diagram shows the relationship between ECG, heart sounds, and pressures in the atrium, ventricle, and aorta.
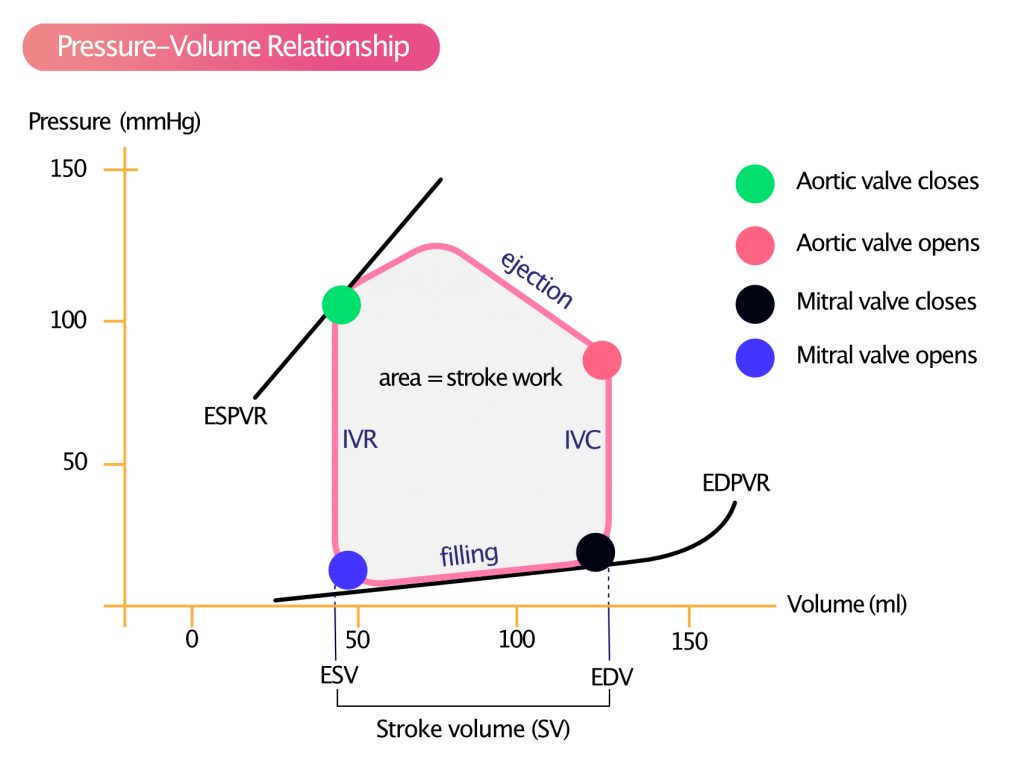
The PV loop illustrates the four phases of the cardiac cycle: filling, isovolumetric contraction, ejection, and isovolumetric relaxation.
The cardiac cycle is best understood by following the pressure and volume changes in the Left Ventricle (LV). Let's break it down into five key phases:
1. Atrial Systole (Atrial Contraction)
- What happens: The atria contract to top off the ventricle (the "atrial kick").
- High-Yield Fact: This corresponds to the "a" wave on the atrial pressure curve and the P wave on the ECG.
- Heart Sound: If you hear a sound here, it's S4 (atrial gallop), which usually indicates a stiff, non-compliant ventricle (like in hypertrophy).
2. Isovolumetric Contraction
- What happens: The LV starts contracting. Pressure rises sharply, but volume stays the same because all valves are closed.
- Heart Sound: S1 occurs at the very beginning of this phase when the Mitral and Tricuspid valves close.
- PV Loop: This is the vertical line on the right side of the loop where pressure goes up but volume is constant.
3. Ventricular Ejection
- What happens: LV pressure exceeds aortic pressure, forcing the Aortic valve to open. Blood is pumped out.
- High-Yield Fact: The volume of blood ejected is the Stroke Volume (SV).
4. Isovolumetric Relaxation
- What happens: The LV stops contracting and starts to relax. Pressure drops rapidly, but again, volume stays the same because all valves are closed.
- Heart Sound: S2 occurs at the start of this phase when the Aortic and Pulmonary valves close.
- PV Loop: This is the vertical line on the left side of the loop.
5. Ventricular Filling
- What happens: LV pressure drops below atrial pressure, and the Mitral valve opens. Blood flows passively into the ventricle.
- Heart Sound: S3 (ventricular gallop) can be heard here. It's normal in kids and athletes but indicates volume overload (like Heart Failure) in older adults.
- PV Loop: This is the horizontal line at the bottom where volume increases at low pressure.
Mnemonic: "COCO" for Valve Events Close (Mitral) -> Open (Aortic) -> Close (Aortic) -> Open (Mitral) This follows the PV loop corners starting from the bottom right!
I've got some great lessons and flashcards that can help you lock this in for your exam. Let me pull those up for you.
📚 Cardiac Cycle Lessons
Those lessons are perfect for a deep dive, especially the one on pressure-volume relationships—it's a USMLE favorite!
To help you lock in these concepts, I've pulled some high-yield flashcards for you to review.
🗂️ Cardiac Cycle Flashcards
Tap to study 22 flashcards in the Oncourse app
The cardiac cycle can feel like a lot to juggle, but if you remember that S1 is the start of systole (mitral closing) and S2 is the start of diastole (aortic closing), you're already halfway there!
The PV loop is especially high-yield for understanding how things like preload (stretching the bottom line to the right) or afterload (making the loop taller) change the shape of the heart's work.
If you want to test your knowledge on these phases, I can set up a quick quiz for you, or we could even try a clinical case to see how these sounds change in real patients. Just let me know what you're in the mood for!
Setting up chat...