
Study Design — MCQs

On this page
A pilot study is conducted to determine the therapeutic response of a new antidepressant drug in patients with persistent depressive disorder. Twelve participants are randomized into a control and a treatment group (n=6 patients in each). They are asked to subjectively rate the severity of their depression from 1 (low) to 10 (high) before and after taking a pill (control group = placebo; treatment group = antidepressant). The data from this study are shown in the following table: Subject Control group Treatment group Depression ranking before intervention Depression ranking after intervention Depression ranking before intervention Depression ranking after intervention 1 7 5 6 4 2 8 6 8 4 3 7 6 9 2 4 5 5 7 5 5 6 6 10 3 6 9 7 6 4 Which of the following is the difference between the median of the depression scores before intervention in the treatment group and the control group?
You are reading through a recent article that reports significant decreases in all-cause mortality for patients with malignant melanoma following treatment with a novel biological infusion. Which of the following choices refers to the probability that a study will find a statistically significant difference when one truly does exist?
On morning labs, a patient's potassium comes back at 5.9 mEq/L. The attending thinks that this result is spurious, and asks the team to repeat the electrolytes. Inadvertently, the medical student, intern, and resident all repeat the electrolytes that same morning. The following values are reported: 4.3 mEq/L, 4.2 mEq/L, and 4.2 mEq/L. What is the median potassium value for that patient that day including the first value?
A 24-year-old woman presents to a medical office for a follow-up evaluation. The medical history is significant for type 1 diabetes, for which she takes insulin. She was recently hospitalized for diabetic ketoacidosis following a respiratory infection. Today she brings in a list of her most recent early morning fasting blood glucose readings for review. Her glucose readings range from 126 mg/dL–134 mg/dL, except for 2 readings of 350 mg/dL and 380 mg/dL, taken at the onset of her recent hospitalization. Given this data set, which measure(s) of central tendency would be most likely affected by these additional extreme values?
A study is being conducted on depression using the Patient Health questionnaire (PHQ-9) survey data embedded within a popular social media network with a response size of 500,000 participants. The sample population of this study is approximately normal. The mean PHQ-9 score is 14, and the standard deviation is 4. How many participants have scores greater than 22?
A cross-sectional study is investigating the association between smoking and the presence of Raynaud phenomenon in adults presenting to a primary care clinic in a major city. A standardized 3-question survey that assesses symptoms of Raynaud phenomenon was used to clinically diagnosis patients if they answered positively to all 3 questions. Sociodemographics, health-related information, and smoking history were collected by trained interviewers. Subjects were grouped by their reported tobacco use: non-smokers, less than 1 pack per day (PPD), between 1-2 PPD, and over 2 PPD. The results were adjusted for gender, age, education, and alcohol consumption. The adjusted odds ratios (OR) were as follows: Non-smoker: OR = reference <1 PPD: OR = 1.49 [95% confidence interval (CI), 1.24-1.79] 1-2 PPD: OR = 1.91 [95% CI, 1.72-2.12] >2 PPD: OR = 2.21 [95% CI, 2.14-2.37] Which of the following is represented in this study and suggests a potential causal relationship between smoking and Raynaud phenomenon?
A research team develops a new monoclonal antibody checkpoint inhibitor for advanced melanoma that has shown promise in animal studies as well as high efficacy and low toxicity in early phase human clinical trials. The research team would now like to compare this drug to existing standard of care immunotherapy for advanced melanoma. The research team decides to conduct a non-randomized study where the novel drug will be offered to patients who are deemed to be at risk for toxicity with the current standard of care immunotherapy, while patients without such risk factors will receive the standard treatment. Which of the following best describes the level of evidence that this study can offer?
During a clinical study on an island with a population of 2540 individuals, 510 are found to have fasting hyperglycemia. Analysis of medical records of deceased individuals shows that the average age of onset of fasting hyperglycemia is 45 years, and the average life expectancy is 70 years. Assuming a steady state of population on the island with no change in environmental risk factors, which of the following is the best estimate of the number of individuals who would newly develop fasting hyperglycemia over 1 year?
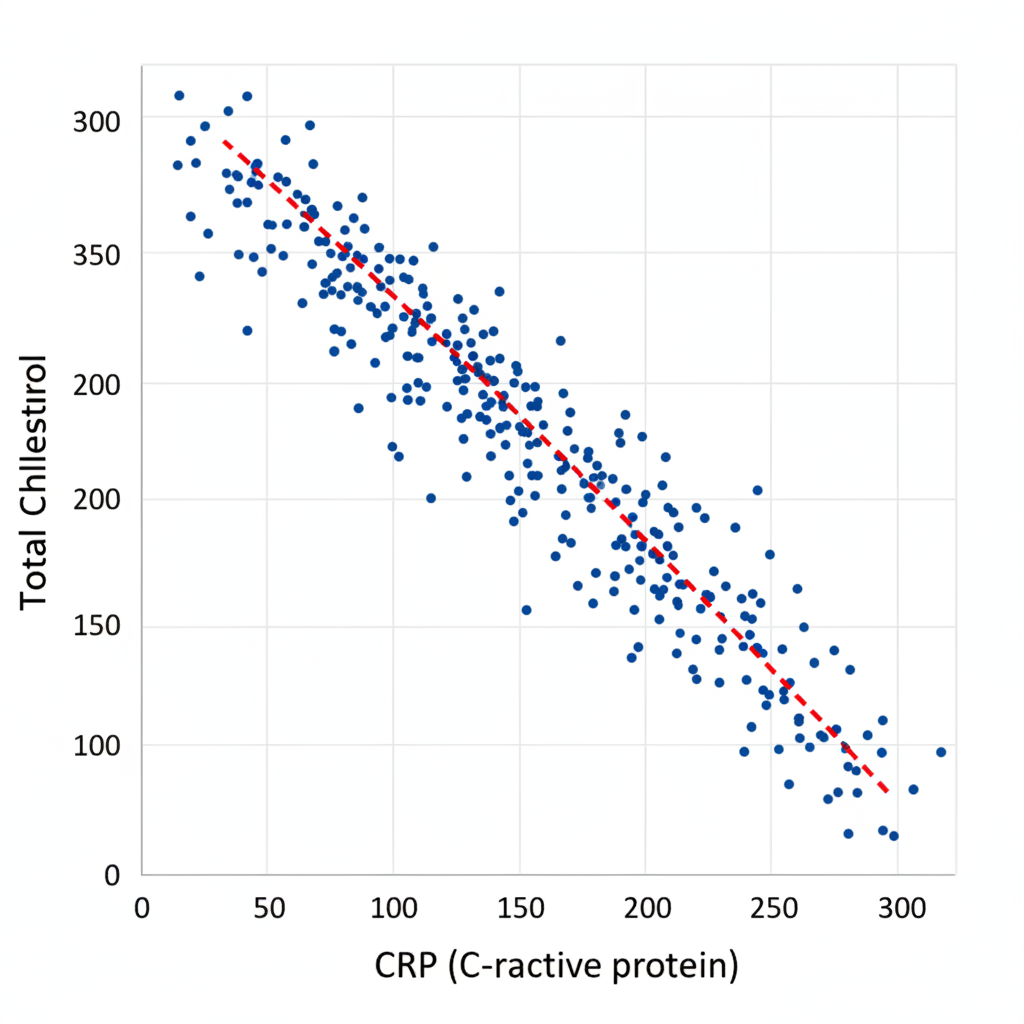
A study aimed to evaluate the relationship between inflammatory markers and lipid metabolism in individuals with rheumatoid arthritis (RA) recruited 252 patients with RA in a tertiary care hospital. Fasting blood samples were taken for lipid profiling and for the assessment of inflammatory markers such as C-reactive protein (CRP) and erythrocyte sedimentation rate. The relationship between CRP and total cholesterol was assessed using Pearson’s correlation coefficient. A scatter plot between CRP and total cholesterol can be seen in the picture. Based on the scatter plot, which of the following can be correctly concluded about the value of the Pearson correlation coefficient, r, for CRP and total cholesterol?
The incidence of a relatively benign autosomal recessive disease, X, is 1 in 25 in the population. Assuming that the conditions for Hardy Weinberg Equilibrium are met, what is the probability that a male and female, who are carriers, will have a child expressing the disease?
Practice by Chapter
Research question formulation
Practice Questions
Case-control studies
Practice Questions
Cross-sectional studies
Practice Questions
Ecological studies
Practice Questions
Quasi-experimental designs
Practice Questions
Natural experiments
Practice Questions
N-of-1 trials
Practice Questions
Mixed methods research
Practice Questions
Qualitative study designs
Practice Questions
Sampling techniques
Practice Questions
Matching methods
Practice Questions
Longitudinal vs cross-sectional approaches
Practice Questions
Multi-center studies
Practice Questions
Pilot and feasibility studies
Practice Questions
Want unlimited practice?
Get full access to all questions, explanations, and performance tracking.
Scan to download app