
Study Design — MCQs

On this page
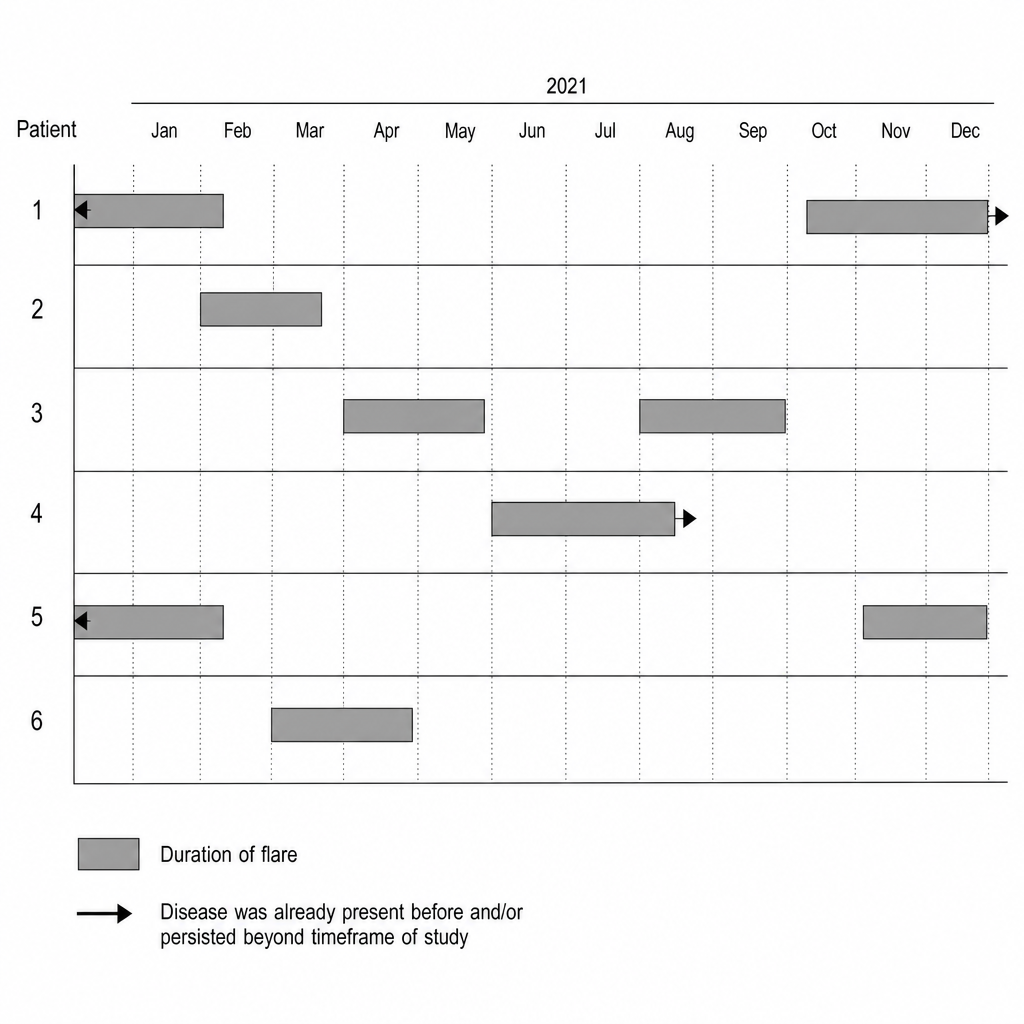
A group of 6 college students with multiple sclerosis (MS) was evaluated for flares in a neurology clinic. The results are shown in the figure. Each row represents a patient. The gray bars represent the duration of the flare. The arrowheads indicate that disease was already present before and/or persisted beyond the timeframe of the study. Based on the figure, which of the following is the most valid statement about MS flares in this group of students?
A 42-year-old man presents to his primary care provider for a follow-up appointment after a new diagnosis of hypertension. The doctor mentions that a recent study examined the effect of a healthy lifestyle education program on blood pressure in 2 matched rural communities. One community received the health education program and the other did not. What is the type of study most likely being described here?
A group of investigators is examining the effect of the drug orlistat as an adjunct therapy to lifestyle modification on weight loss in obese volunteers. 800 obese participants were randomized to receive orlistat in addition to counseling on lifestyle modification and 800 obese participants were randomized to receive counseling on lifestyle modification alone. At the conclusion of the study, the investigators found that patients who underwent combined therapy lost a mean of 8.2 kg (18.1 lb), whereas patients counseled on lifestyle modification alone lost a mean of 4.3 kg (9.5 lb) (p < 0.001). The investigators also observed that of the 120 participants who did not complete the study, 97 participants were in the lifestyle modification group and 23 participants were in the combination group. Based on this information, the investigators should be most concerned about which of the following?
A first-year medical student is analyzing data in a nationwide cancer registry. She identified a group of patients who had recently undergone surgery for epithelial ovarian cancer and achieved a complete clinical response to chemotherapy. Some of these patients had been scheduled to receive annual abdominal CTs while other patients had not been scheduled for such routine imaging surveillance. The medical student then identified a subgroup of patients who have developed recurrent metastatic disease despite their previous complete clinical response to chemotherapy and surgery. She compared patients who were diagnosed with metastatic cancer during routine follow-up imaging with patients who were diagnosed with metastatic cancer based on clinical symptoms at routine follow-up history and physical exams. She found that the average survival of patients who underwent routine imaging was four months longer than the survival of their peers who were diagnosed based on history and physical exam. Which of the following is a reason why these results should be interpreted with caution?
A cross-sectional oral health survey was designed to assess both functional and psychosocial effects of dental disease on the elderly population of Buda, Texas (US). Printed surveys that consisted of 50 open-ended questions on dental disease history and dental hygiene were mailed to the selected members of a target population. However, the response rate was not satisfactory, as a large percentage of the selected study participants either did not return the survey or failed to answer all of the questions posed. The researchers opted for 2 strategies: prompt those who did not respond with a second letter that guaranteed complete confidentiality and broaden the pool of selected participants. Depending on the final response rate and the researchers’ statistical skills, the bias in the final publication will be more pronounced if...?
A research group wants to assess the relationship between childhood diet and cardiovascular disease in adulthood. A prospective cohort study of 500 children between 10 to 15 years of age is conducted in which the participants' diets are recorded for 1 year and then the patients are assessed 20 years later for the presence of cardiovascular disease. A statistically significant association is found between childhood consumption of vegetables and decreased risk of hyperlipidemia and improved exercise tolerance. When these findings are submitted to a scientific journal, a peer reviewer comments that the researchers did not discuss the study's validity. Which of the following additional analyses would most likely address the concerns about this study's design?
You are conducting a study on hypertension for which you have recruited 60 African-American adults. If the biostatistician for your study informs you that the sample population of your study is approximately normal, the mean systolic blood pressure is 140 mmHg, and the standard deviation is 7 mmHg, how many participants would you expect to have a systolic blood pressure between 126 and 154 mmHg?
A new study shows a significant association between patients with a BMI >40 and a diagnosis of diabetes (odds ratio: 7.37; 95% CI 6.39-8.50) compared to non-diabetic patients. Which of the following hypothetical studies most likely yielded these results?
After learning in a lecture that cesarean section rates vary from < 0.5% to over 30% across countries, a medical student wants to investigate if national cesarean section rates correlate with national maternal mortality rates worldwide. For his investigation, the student obtains population data from an international registry that contains tabulated cesarean section rates and maternal mortality rates from the last 10 years for a total of 119 countries. Which of the following best describes this study design?
A grant reviewer at the National Institutes of Health is determining which of two studies investigating the effects of gastric bypass surgery on fasting blood sugar to fund. Study A is spearheaded by a world renowned surgeon, is a multi-center study planning to enroll 50 patients at each of 5 different sites, and is single-blinded. Study B plans to enroll 300 patients from a single site and will be double-blinded by virtue of a sham surgery for the control group. The studies both plan to use a t-test, and they both report identical expected treatment effect sizes and variance. If the reviewer were interested only in which trial has the higher power, which proposal should he fund?
Practice by Chapter
Research question formulation
Practice Questions
Case-control studies
Practice Questions
Cross-sectional studies
Practice Questions
Ecological studies
Practice Questions
Quasi-experimental designs
Practice Questions
Natural experiments
Practice Questions
N-of-1 trials
Practice Questions
Mixed methods research
Practice Questions
Qualitative study designs
Practice Questions
Sampling techniques
Practice Questions
Matching methods
Practice Questions
Longitudinal vs cross-sectional approaches
Practice Questions
Multi-center studies
Practice Questions
Pilot and feasibility studies
Practice Questions
Want unlimited practice?
Get full access to all questions, explanations, and performance tracking.
Scan to download app