
Effect sizes and confidence intervals — MCQs

Group of 100 medical students took an end of the year exam. The mean score on the exam was 70%, with a standard deviation of 25%. The professor states that a student's score must be within the 95% confidence interval of the mean to pass the exam. Which of the following is the minimum score a student can have to pass the exam?
You are conducting a study comparing the efficacy of two different statin medications. Two groups are placed on different statin medications, statin A and statin B. Baseline LDL levels are drawn for each group and are subsequently measured every 3 months for 1 year. Average baseline LDL levels for each group were identical. The group receiving statin A exhibited an 11 mg/dL greater reduction in LDL in comparison to the statin B group. Your statistical analysis reports a p-value of 0.052. Which of the following best describes the meaning of this p-value?
An investigator is studying the effect of antihypertensive drugs on cardiac output and renal blood flow. For comparison, a healthy volunteer is given a placebo and a continuous infusion of para-aminohippuric acid (PAH) to achieve a plasma concentration of 0.02 mg/ml. His urinary flow rate is 1.5 ml/min and the urinary concentration of PAH is measured to be 8 mg/ml. His hematocrit is 50%. Which of the following values best estimates cardiac output in this volunteer?
An epidemiologist is evaluating the efficacy of Noxbinle in preventing HCC deaths at the population level. A clinical trial shows that over 5 years, the mortality rate from HCC was 25% in the control group and 15% in patients treated with Noxbinle 100 mg daily. Based on this data, how many patients need to be treated with Noxbinle 100 mg to prevent, on average, one death from HCC?
A researcher is examining the relationship between socioeconomic status and IQ scores. The IQ scores of young American adults have historically been reported to be distributed normally with a mean of 100 and a standard deviation of 15. Initially, the researcher obtains a random sampling of 300 high school students from public schools nationwide and conducts IQ tests on all participants. Recently, the researcher received additional funding to enable an increase in sample size to 2,000 participants. Assuming that all other study conditions are held constant, which of the following is most likely to occur as a result of this additional funding?
You submit a paper to a prestigious journal about the effects of coffee consumption on mesothelioma risk. The first reviewer lauds your clinical and scientific acumen, but expresses concern that your study does not have adequate statistical power. Statistical power refers to which of the following?
A 28-year-old male presents to his primary care physician with complaints of intermittent abdominal pain and alternating bouts of constipation and diarrhea. His medical chart is not significant for any past medical problems or prior surgeries. He is not prescribed any current medications. Which of the following questions would be the most useful next question in eliciting further history from this patient?
A researcher is investigating the effects of a new antihypertensive medication on renal physiology. She gives a subject a dose of the new medication, and she then collects plasma and urine samples. She finds the following: Hematocrit: 40%; Serum creatinine: 0.0125 mg/mL; Urine creatinine: 1.25 mg/mL. Urinary output is 1 mL/min. Renal blood flow is 1 L/min. Based on the above information and approximating that the creatinine clearance is equal to the GFR, what answer best approximates filtration fraction in this case?
You are interested in studying the etiology of heart failure reduced ejection fraction (HFrEF) and attempt to construct an appropriate design study. Specifically, you wish to look for potential causality between dietary glucose consumption and HFrEF. Which of the following study designs would allow you to assess for and determine this causality?
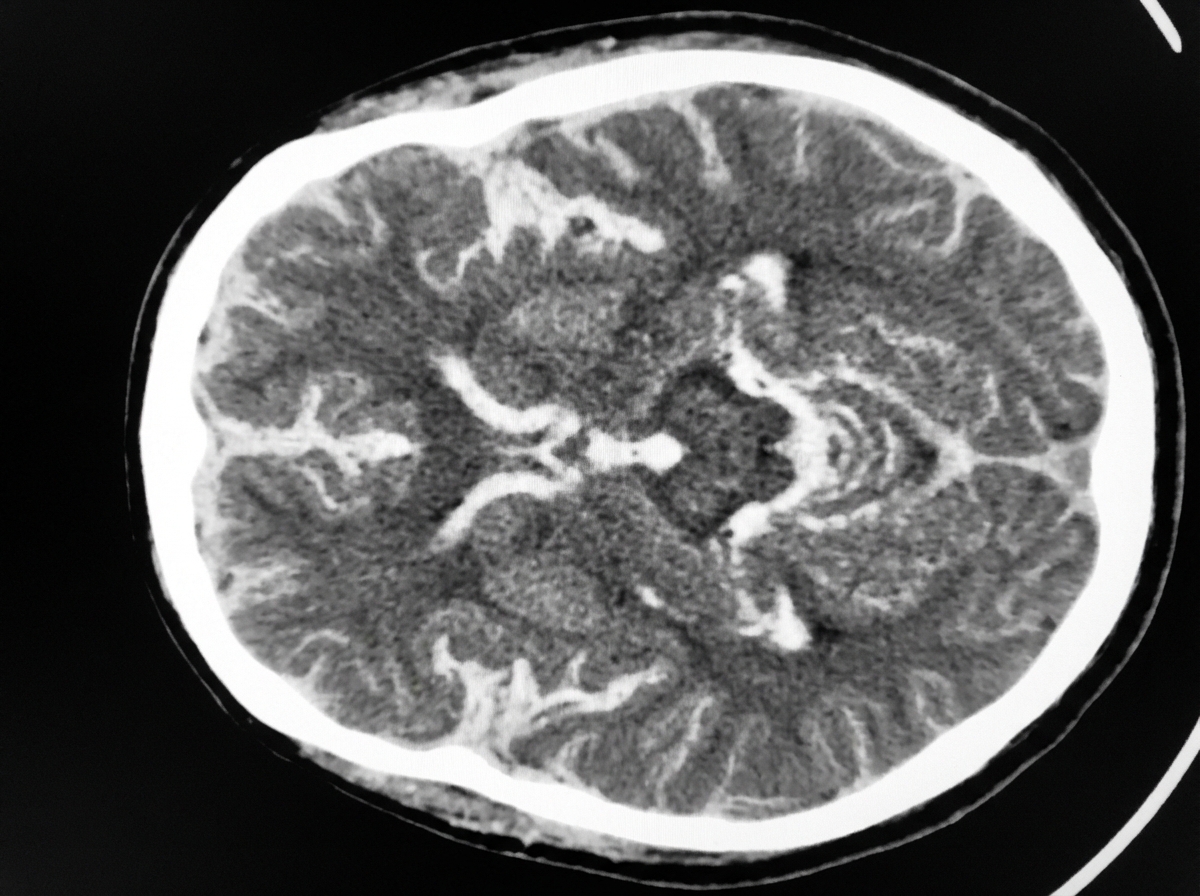
A 54-year-old man is brought to the emergency department 30 minutes after being hit by a car while crossing the street. He had a left-sided tonic-clonic seizure and one episode of vomiting while being transported to the hospital. On arrival, he is not oriented to person, place, or time. Physical examination shows flaccid paralysis of all extremities. A CT scan of the head is shown. This patient's symptoms are most likely the result of a hemorrhage in which of the following structures?
Want unlimited practice?
Get full access to all questions, explanations, and performance tracking.
Scan to download app