
Odds ratio vs. relative risk — MCQs

On this page
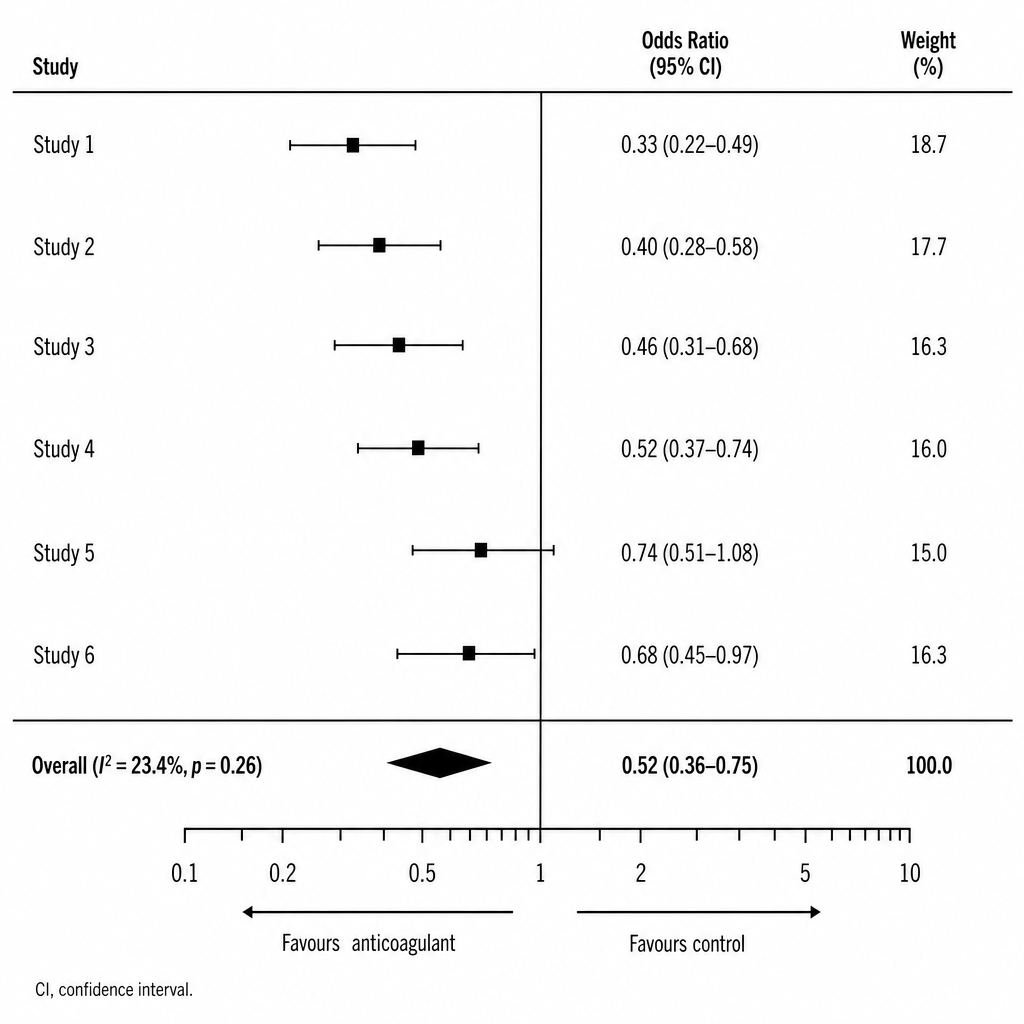
An investigator presents a forest plot from a meta-analysis of six RCTs examining whether a new anticoagulant reduces stroke in patients with non-valvular atrial fibrillation. The image shows individual study odds ratios with 95% confidence intervals and an overall pooled estimate. Studies 1–4 show confidence intervals entirely to the left of the line of no effect. Study 5 shows a confidence interval of 0.74 (95% CI: 0.51–1.08). Study 6 shows a confidence interval of 0.68 (95% CI: 0.45–0.97). Which of the following conclusions is best supported by these results?
A research fellow proposes a nested case-control study within an existing cohort examining antibiotic exposure and C. difficile infection. The mentor suggests this design wastes the cohort structure and that relative risk should be calculated instead. The fellow argues that odds ratios from nested case-control studies approximate relative risk while being more efficient. Evaluate the validity of each position and synthesize the optimal approach.
Two studies examine statin therapy and stroke prevention. Study A (cohort, n=10,000) reports RR=0.75. Study B (case-control, n=2,000) reports OR=0.68. The absolute stroke rate in the general population is 2% over 5 years. Analyze these findings to determine which study provides more accurate information for clinical decision-making and why.
A genetic epidemiology study uses a case-control design to examine BRCA1 mutations and breast cancer risk, reporting an odds ratio of 15.0 (95% CI: 8.2-27.4). A patient with a BRCA1 mutation asks what this means for her actual risk of developing breast cancer. Evaluate how to appropriately counsel this patient regarding the study findings.
A hospital quality improvement team analyzes surgical site infections (SSI) following colorectal surgery. In Year 1 (pre-intervention), 50 of 500 surgeries resulted in SSI. After implementing a bundle protocol in Year 2, 20 of 500 surgeries resulted in SSI. The team debates whether to report odds ratio or relative risk. Apply your understanding to select the most appropriate measure and calculate it.
Practice by Chapter
Definition and calculation of odds ratio
Practice Questions
Definition and calculation of relative risk
Practice Questions
Interpretation differences
Practice Questions
When odds ratio approximates relative risk
Practice Questions
Common misinterpretations
Practice Questions
Application in different study designs
Practice Questions
Adjusted odds ratios
Practice Questions
Confidence intervals for OR and RR
Practice Questions
Reporting in medical literature
Practice Questions
Absolute risk vs relative measures
Practice Questions
Number needed to treat relation
Practice Questions
Meta-analysis of odds ratios and relative risks
Practice Questions
Want unlimited practice?
Get full access to all questions, explanations, and performance tracking.
Scan to download app