
Cohort studies — MCQs

On this page
A recently published prospective cohort study of 1,000 men reports that smoking is significantly associated with higher rates of esophageal cancer. The next week, however, the journal publishes a letter to the editor in which a re-analysis of the study's data when accounting for the confounding effects of alcohol usage found no association between smoking and esophageal cancer. Which of the following statements is both necessary and sufficient to explain the change in result?
Two separate investigators have conducted cohort studies to calculate the risk of lymphoma in rheumatoid arthritis patients taking anti-TNF alpha medications. They each followed patients with rheumatoid arthritis for a number of years and tracked the number of patients who were diagnosed with lymphoma. The results of the two studies are summarized in the table. Number of patients Follow-up period Number of new cases of lymphoma Study 1 3000 10 years 30 Study 2 300 30 years 9 Based on these results, which of the following statements about the risk of lymphoma is most accurate?
An investigator is studying the efficacy of preventative measures to reduce pesticide poisonings among Central American farmers. The investigator evaluates the effect of a ban on aldicarb, an especially neurotoxic pesticide of the carbamate class. The ban aims to reduce pesticide poisonings attributable to carbamates. The investigator followed 1,000 agricultural workers residing in Central American towns that banned aldicarb as well as 2,000 agricultural workers residing in communities that continued to use aldicarb over a period of 5 years. The results show: Pesticide poisoning No pesticide poisoning Total Aldicarb ban 10 990 1000 No aldicarb ban 100 1900 2000 Which of the following values corresponds to the difference in risk attributable to the ban on aldicarb?
A clinical study is performed to examine the effect of smoking on the development of pulmonary hypertension (PAH) in a sample of 40-year-old women. A group of 1,000 matched healthy subjects (500 controls; 500 smokers) were monitored for the development of (PAH) from enrollment to death. The data from the study are shown in the table below: Group\PAH Yes No Smokers 35 465 Controls 20 480 Which of the following is correct regarding the risk of developing PAH from this study?
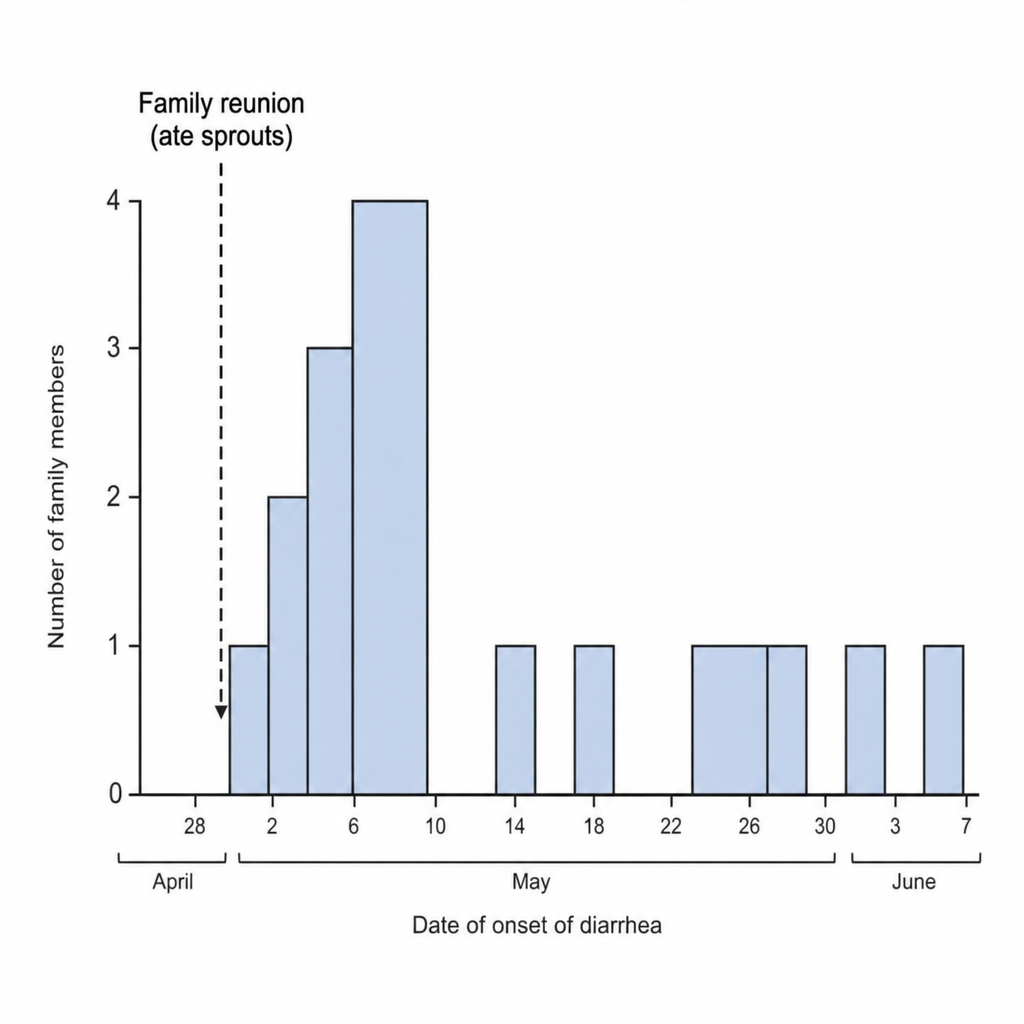
A team of epidemiologists is investigating an outbreak of hemolytic uremic syndrome (HUS) caused by Shiga toxin-producing E. coli O104:H4. In Europe, multiple episodes of illness were reported in May 2011 within a large extended family of 16 family members, who all attended a family reunion in late April where they ate sprouts contaminated with E. coli. In the ensuing weeks, multiple family members were admitted to local hospitals for treatment of HUS. A graph depicting the course of the disease is shown. Each row represents a patient. The gray bars represent the duration of the disease. Based on the graph, which of the following is the attack rate among the individuals at risk in the month of May?
In recent years, psoriasis has been identified as a risk factor for cardiovascular disease. A researcher conducted a study in which he identified 200 patients with psoriasis and 200 patients without psoriasis. The patients were followed for 10 years. At the end of this period, participants' charts were reviewed for myocardial infarction during this time interval. Myocardial infarction No myocardial infarction Total Psoriasis 12 188 200 No psoriasis 4 196 200 Total 16 384 400 What is the 10-year risk of myocardial infarction in participants with psoriasis?
Researchers are studying a farming community with a high incidence of acute myelogenous leukemia (AML). A retrospective cohort study is performed looking at the relationship between exposure to a certain pesticide chemical and the risk of developing AML. In 84 patients who developed AML, 17 had exposure to the pesticide chemical. In the control group of 116 patients, 2 had exposure to the chemical. What is the relative risk of developing AML upon exposure to the pesticide in this study group?
A 45-year-old man comes to the clinic concerned about his recent exposure to radon. He heard from his co-worker that radon exposure can cause lung cancer. He brings in a study concerning the risks of radon exposure. In the study, there were 300 patients exposed to radon, and 18 developed lung cancer over a 10-year period. To compare, there were 500 patients without radon exposure and 11 developed lung cancer over the same 10-year period. If we know that 0.05% of the population has been exposed to radon, what is the attributable risk percent for developing lung cancer over a 10 year period after radon exposure?
A researcher has identified a chemical compound that she expects may contribute to the development of colorectal cancer. She designs an experiment where she exposes 70 mice to a diet containing this compound with another 50 mice in a control group that was fed a regular diet. After 9 months, the mice were evaluated for tumor development at necropsy. In total, 14 mice in the experimental group developed colorectal tumor burden, and 1 mouse in the control group developed tumors. Based on this experiment, what risk of colorectal cancer can be attributable to this chemical compound?
A prospective cohort study is conducted to evaluate the risk of pleural mesothelioma in construction workers exposed to asbestos in Los Angeles. Three hundred construction workers reporting current occupational asbestos exposure were followed alongside 300 construction workers without a history of asbestos exposure. After 8 years of follow-up, no statistically significant difference in the incidence of pleural mesothelioma was observed between the two groups (p = 0.13), even after controlling for known mesothelioma risk factors such as radiation, age, and sex. Which of the following is the most likely explanation for the observed results of this study?
Practice by Chapter
Prospective cohort design
Practice Questions
Retrospective cohort design
Practice Questions
Exposure assessment
Practice Questions
Follow-up methods
Practice Questions
Loss to follow-up handling
Practice Questions
Time-to-event analysis
Practice Questions
Survival curves
Practice Questions
Cox proportional hazards model
Practice Questions
Competing risks
Practice Questions
Nested case-control studies
Practice Questions
Case-cohort studies
Practice Questions
Historical cohorts
Practice Questions
Strengths and limitations of cohort studies
Practice Questions
Want unlimited practice?
Get full access to all questions, explanations, and performance tracking.
Scan to download app