
Respiratory System — MCQs

On this page
Which of the following describes the chloride ion exchange in red blood cells, where bicarbonate ions are exchanged for chloride ions to maintain electrical neutrality?
A 45-year-old man undergoes spirometry testing. His results show FEV1 2.8 L (70% predicted), FVC 5.0 L (100% predicted), and FEV1/FVC ratio of 0.56. He has a 20-pack-year smoking history. What is the underlying pathophysiological mechanism for his reduced FEV1/FVC ratio?
Surface tension of the fluid lining the alveoli increases during:
Effect of pulmonary embolism on graph of V/Q?
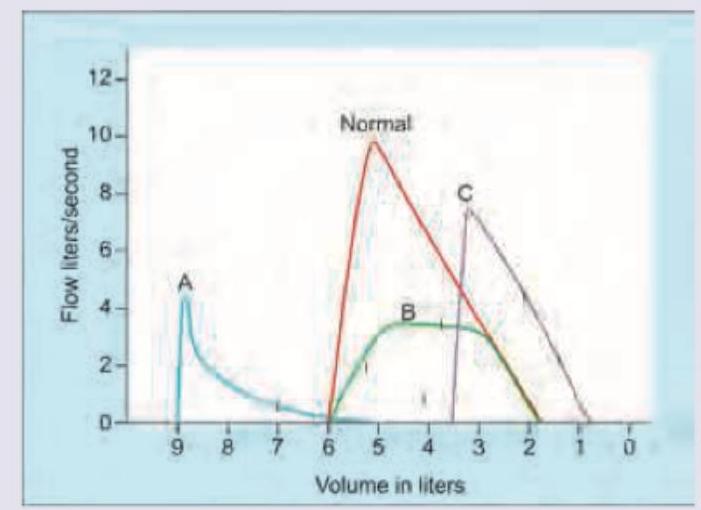
Which of the following is correct about the flow volume curve shown below? (Recent NEET Pattern 2016-17)
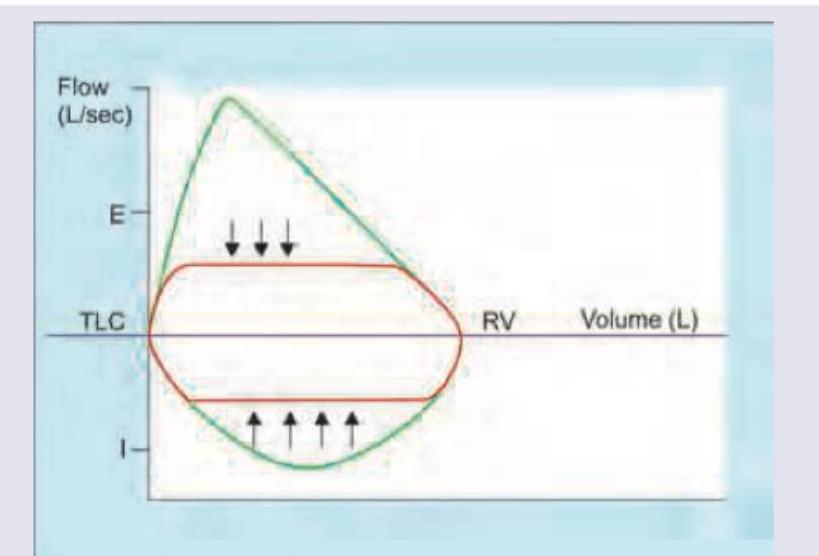
Which flow volume curve recording is shown below?
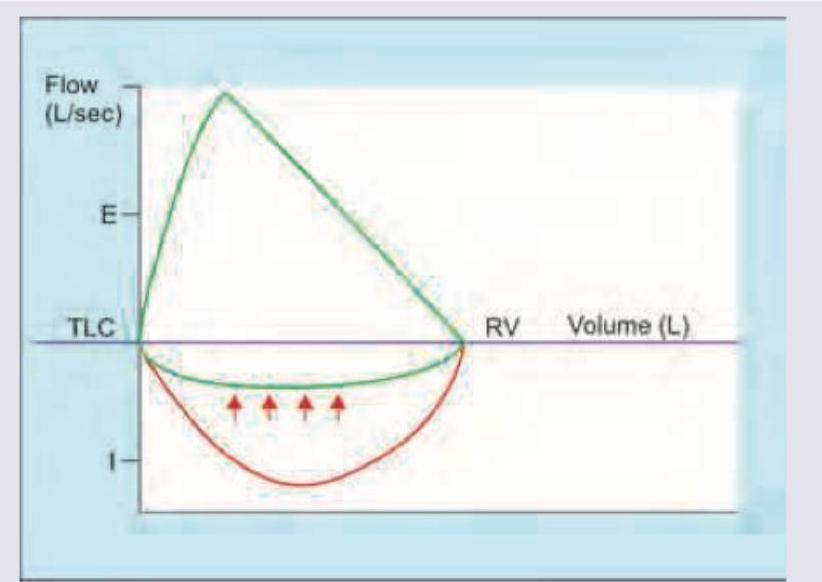
Which flow volume curve recording is shown below?
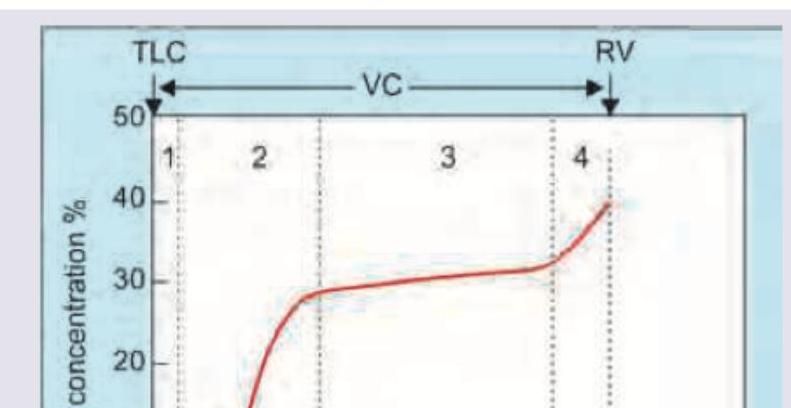
Which of the following areas of nitrogen washout test indicate closing volume?
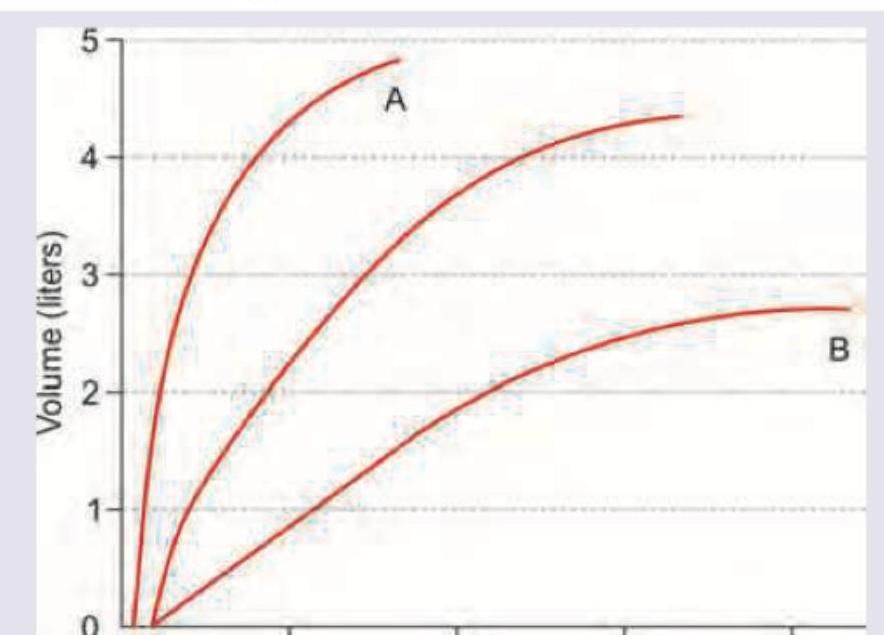
Which statement related to lung compliance shown in the image below is correct:
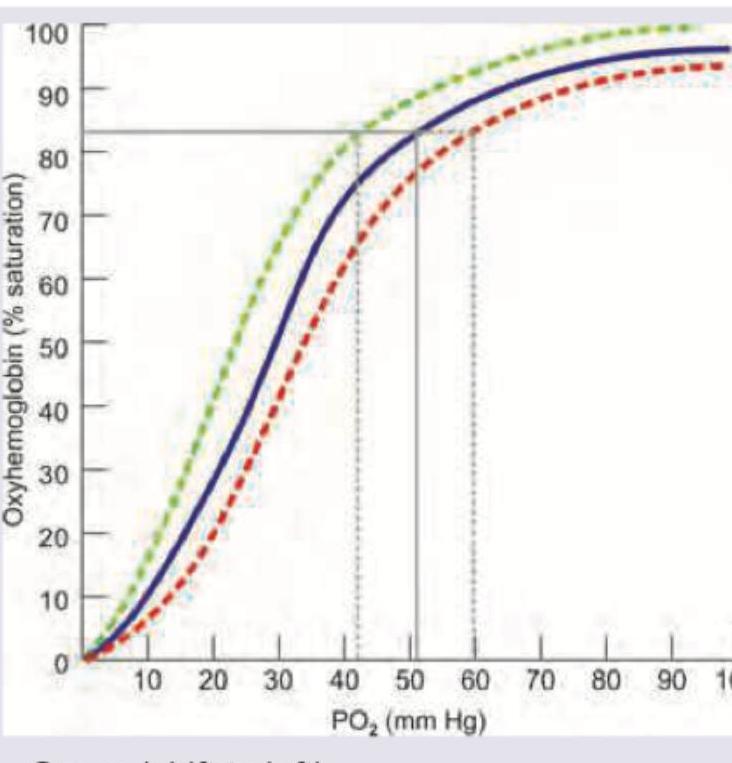
The baseline oxyhemoglobin dissociation curve is depicted in blue color. Shift of curve to which side indicates Bohr effect?
Practice by Chapter
Mechanics of Breathing
Practice Questions
Pulmonary Ventilation
Practice Questions
Pulmonary Circulation
Practice Questions
Gas Exchange in the Lungs
Practice Questions
Oxygen and Carbon Dioxide Transport
Practice Questions
Control of Breathing
Practice Questions
Respiratory Adjustments in Health and Disease
Practice Questions
High Altitude Physiology
Practice Questions
Diving Physiology
Practice Questions
Respiratory Function Tests
Practice Questions
Want unlimited practice?
Get full access to all questions, explanations, and performance tracking.
Scan to download app