In a programme, analysis of results in comparison to cost is known as
What is the most cost-effective screening for identifying carcinoma cervix in a population?
Which one of the following is a quantitative method of health management?
Which one among the following was used for measuring economic status of households, in the National Family Health Survey-III (NFHS-III) ?
The life expectancy at birth for a country A is 64 years. The minimum and maximum values of life expectancy are 20 years and 86 years respectively. As part of Human Development Index (HDI), what is the Life Expectancy Index for the country A ?
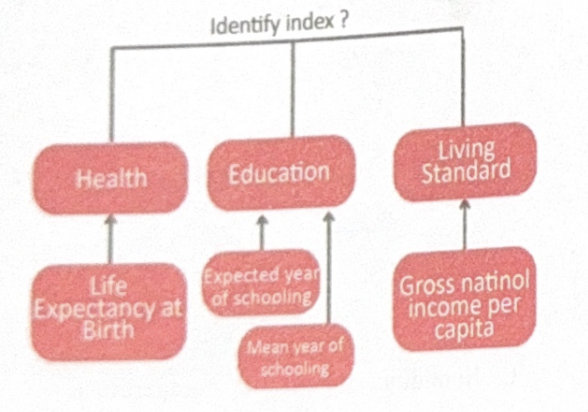
Identify the index?

Which intervention has shown the highest return on investment in national STI control programs?
Which of the following evaluation methods primarily involves monetary terms?
In ESI, employee contributes what percentage of wages?
Which of the following best describes economic blindness?
Explanation: ***Cost benefit analysis*** - In **cost-benefit analysis**, the **benefits of a program** are quantified in monetary terms and then compared directly with the **monetary cost** of the program. - This method is used to determine if the **monetary gain (or benefit)** from a program outweighs its monetary expenditure. *Cost effective analysis* - **Cost-effectiveness analysis** compares the **costs of alternative programs** with their effectiveness, usually measured in natural units suitable for the health outcome (e.g., lives saved, cases cured). - It does not assign a monetary value to the health outcome but rather identifies the intervention that achieves the **desired outcome at the lowest cost** or the maximum outcome for a given cost. *Management by objectives* - **Management by objectives (MBO)** is a strategic management model that aims to improve organizational performance by clearly defining objectives that are agreed to by both management and employees. - This concept is primarily about **setting goals and tracking performance** within an organization, not about analyzing program costs versus outcomes. *Cost utility study* - A **cost-utility analysis (CUA)** is a type of cost-effectiveness analysis where the health outcome is measured in **quality-adjusted life years (QALYs)** or disability-adjusted life years (DALYs). - It accounts for both the **quantity and quality of life**, but it still does not express benefits in direct monetary terms.
Explanation: ***Correct: High risk selective screening*** - **High-risk selective screening** is the **most cost-effective** strategy for cervical cancer screening as it targets populations with higher disease prevalence - Focuses resources on women at increased risk: age 30-65 years, multiple sexual partners, early sexual debut, HPV exposure, immunocompromised status, low socioeconomic status - **Maximizes detection yield per rupee spent** by concentrating efforts where disease probability is highest - Aligns with **WHO recommendations** and national guidelines for resource-limited settings - Better **cost-benefit ratio** compared to screening the entire population including low-risk groups *Incorrect: Mass screening* - Mass screening involves screening the **entire population** regardless of risk factors - While it may identify more total cases, it is **not cost-effective** as it expends resources on large low-risk populations - The question specifically asks for "**most cost-effective**" approach, not maximum coverage - In resource-limited settings (relevant for India), targeted screening provides better value *Incorrect: Multiphasic screening* - Refers to using **multiple screening tests** simultaneously for different diseases - Increases complexity and cost when applied to multiple conditions - Not specifically addressing cost-effectiveness for **single disease** (cervical cancer) screening *Incorrect: Prospective screening* - This term typically refers to **research methodology** involving forward-looking cohort studies - Not a standard classification of population screening strategies - More resource-intensive and used in research settings rather than routine public health programs
Explanation: ***Cost effectiveness analysis*** - This method uses **mathematical and statistical techniques** to compare the costs and health outcomes of different interventions, making it a quantitative approach. - It involves calculating metrics like the **incremental cost-effectiveness ratio (ICER)** to guide resource allocation decisions. *Communication management* - This involves strategies for **effective information exchange** within an organization and with external stakeholders, which is primarily a qualitative process. - While it can be measured (e.g., surveys), the core activity is not based on numerical data analysis for direct health outcomes. *Human Resource Management* - This focuses on managing an organization's **workforce**, including staffing, training, and performance evaluation. - It's mainly a qualitative and administrative function, although some aspects like budgeting for salaries might involve quantitative data. *Supportive supervision and leadership* - This involves **guiding and motivating staff** to achieve organizational goals and improve performance. - These are primarily **qualitative skills** and management styles, focusing on interpersonal interactions and team building.
Explanation: ***Wealth index*** - The **National Family Health Survey-III (NFHS-III)** used a **wealth index** as a primary measure to assess the economic status of households. - This index is a composite measure derived from household assets and housing characteristics. *Lifestyle index* - The term "lifestyle index" is a general concept and was not the specific, officially recognized tool for measuring economic status in NFHS-III. - While lifestyle aspects can be indicators of economic status, they are typically integrated into broader indices like the wealth index rather than being a standalone measure in this context. *Pareek scale* - The **Pareek scale** was not used in NFHS-III for measuring household economic status. - The Pareek scale is a socio-economic status scale that primarily focuses on **occupational prestige** and education, and it is less commonly used for national health surveys in India compared to asset-based indices. *Kuppuswamy's scale* - **Kuppuswamy's Socioeconomic Status Scale** was not used in the NFHS-III survey. - This scale is an older and more commonly used tool in clinical and research settings within India, but it primarily classifies families based on **education** and **occupation** of the head of the family, and family income.
Explanation: **0.667** - The Life Expectancy Index (LEI) is a component of the Human Development Index (HDI). - Formula: **LEI = (Actual Life Expectancy - Minimum Life Expectancy) / (Maximum Life Expectancy - Minimum Life Expectancy)** - Calculation: (64 - 20) / (86 - 20) = 44 / 66 = **0.667** - The index ranges from 0 to 1, where higher values indicate better life expectancy relative to the reference range. *0.512* - This value would result from calculation errors, such as using incorrect minimum or maximum values. - For example, if a different denominator was used or if the actual life expectancy was miscalculated. *0.970* - This value is too high and suggests a calculation error. - An index of 0.970 would indicate the country's life expectancy is 84 years (very close to the maximum of 86 years). *0.744* - This value does not correspond to the given parameters. - Could result from arithmetic errors or using different reference values for minimum/maximum life expectancy. - Using the correct formula with given values yields 0.667, not 0.744.
Explanation: ***Human developmental index*** - The **Human Development Index (HDI)** is the correct answer as the diagram exactly represents its three core dimensions - HDI measures overall achievement in: **Health** (life expectancy at birth), **Education** (mean years of schooling and expected years of schooling), and **Living standards** (GNI per capita) - These are the standard components published by UNDP for calculating HDI - HDI is a summary measure of average achievement in key dimensions of human development *Human poverty index* - The Human Poverty Index (HPI) was an older measure that has been discontinued - HPI focused on deprivations rather than overall development achievements - The diagram shows development indicators (positive achievements), not deprivation indicators - HPI has been replaced by the Multidimensional Poverty Index (MPI) *POLI* - **POLI** (Physical Quality of Life Index) is a different index that uses infant mortality, life expectancy at age one, and literacy rate - The components shown in the diagram (mean years of schooling, expected years of schooling, GNI per capita) are not part of POLI - This is not a recognized standard index in current use *Multidimensional poverty index* - The **Multidimensional Poverty Index (MPI)** measures acute multidimensional poverty across health, education, and living standards - However, MPI uses **different specific indicators**: nutrition, child mortality, years of schooling, school attendance, cooking fuel, sanitation, drinking water, electricity, housing, and assets - The diagram shows HDI components (life expectancy, mean/expected years of schooling, GNI per capita), which are NOT the MPI indicators - MPI focuses on deprivations at the household level, while the diagram shows aggregate development measures
Explanation: ***Integration with HIV services*** - This approach offers the **highest return on investment** for national STI control programs as it leverages existing infrastructure and funding for HIV services, maximizing resource utilization. - **Syndromic management of STIs integrated with HIV care** allows for efficient screening, diagnosis, and treatment of both conditions simultaneously, reaching high-risk populations effectively. - **India's National AIDS Control Programme (NACP)** successfully demonstrates this model, with STI/RTI services integrated into HIV testing and counseling centers, reducing duplication and operational costs. - **WHO guidelines strongly recommend** this integration strategy as the most cost-effective approach for national STI control programs, particularly in resource-limited settings. *Mobile testing units* - While helpful for reaching underserved populations, **mobile units have high operational costs** including staffing, vehicle maintenance, and equipment, which significantly limit their overall return on investment. - Their effectiveness is often localized and may not provide broad, sustainable impact across an entire national program compared to integrated services. *Online partner notification* - This method's reach is limited by **digital literacy and access barriers**, potentially excluding high-risk groups without internet access, particularly relevant in the Indian context. - While it can improve partner tracing in certain populations, the initial setup costs and limited universal applicability reduce its overall cost-effectiveness compared to integrated clinical services. *Mass media campaigns* - These campaigns require **significant financial investment** for broadcast time and creative development, with outcomes that are difficult to quantify in terms of direct STI reduction. - While effective for raising general awareness, they generate less measurable return on investment for direct STI control services compared to targeted clinical interventions like integrated service delivery.
Explanation: ***Cost benefit analysis*** - This method evaluates both the **costs** and **benefits** of a project or intervention in **monetary terms**. - It is the **only economic evaluation method** that expresses **both costs AND outcomes (benefits) in monetary units**. - This allows for a direct comparison of the financial value of benefits against the financial value of costs to determine overall worth and calculate net benefit or benefit-cost ratio. *Network analysis* - **Network analysis** is a quantitative method that focuses on relationships or connections between entities. - It is primarily used for understanding **structures and patterns** in complex systems (like disease transmission networks), not for direct monetary valuation. - This is **not an economic evaluation method**. *Cost minimization analysis* - This method compares only the **costs** of two or more interventions that are proven to have **equivalent outcomes or effectiveness**. - While it deals with costs in monetary terms, it **does not express benefits/outcomes in monetary units** - it simply assumes they are equal. - The primary goal is to identify the **least expensive option** among equally effective alternatives, not to monetize outcomes.
Explanation: ***1.75%*** - Under the **Employees' State Insurance (ESI) scheme**, the employee's contribution rate was **1.75% of their monthly wages** (prior to 2019 amendment) [1]. - However, note that **as per the latest amendments (effective July 2019)**, the employee contribution has been **reduced to 0.75%** and employer contribution to 3.25%. - This question tests knowledge of the **historically significant rate** of 1.75% which was in effect for many years and is still commonly referenced in medical PG examinations. *4.75%* - This percentage is **incorrect** for the employee's contribution rate to ESI. - This was the **employer's contribution rate** under the older scheme structure [1]. *3.75%* - This figure is **not a standard ESI employee contribution rate**. - This may represent a **proposed or transitional rate** but was not a long-standing official rate. *2.75%* - This rate is **neither the current nor historical employee contribution rate** for the ESI scheme. - This does not correspond to any **standard ESI contribution structure**.
Explanation: ***A level of blindness that prevents an individual from earning a livelihood*** - **Economic blindness** refers to the degree of vision impairment severe enough to render an individual unable to perform economically productive tasks. - This definition emphasizes the **socioeconomic impact** of vision loss rather than the clinical severity alone. *Blindness that is expensive to treat* - This option describes **costly treatments** for blindness, which is a different aspect of healthcare economics. - While treatment costs can be a burden, they do not define the concept of economic blindness itself. *Blindness affecting only economically disadvantaged populations* - While **disadvantaged populations** may have a higher prevalence of blindness, economic blindness can affect individuals from any socioeconomic background if their vision loss prevents them from working. - This option incorrectly limits the scope of economic blindness to a specific demographic. *Blindness due to economic factors like malnutrition* - This option describes the **etiology** or cause of blindness (e.g., malnutrition due to poverty). - While economic factors can certainly lead to vision impairment, **economic blindness** refers to the functional impact of blindness on an individual's ability to earn a living, not its cause.
Basic Concepts in Health Economics
Practice Questions
Health Financing Mechanisms
Practice Questions
Cost-Benefit Analysis
Practice Questions
Cost-Effectiveness Analysis
Practice Questions
Health Insurance Systems
Practice Questions
National Health Accounts
Practice Questions
Healthcare Market Analysis
Practice Questions
Economic Evaluation of Health Programs
Practice Questions
Resource Allocation in Healthcare
Practice Questions
Direct and Indirect Health Costs
Practice Questions
Health Budget Planning
Practice Questions
Economic Burden of Disease
Practice Questions
Get full access to all questions, explanations, and performance tracking.
Start For Free