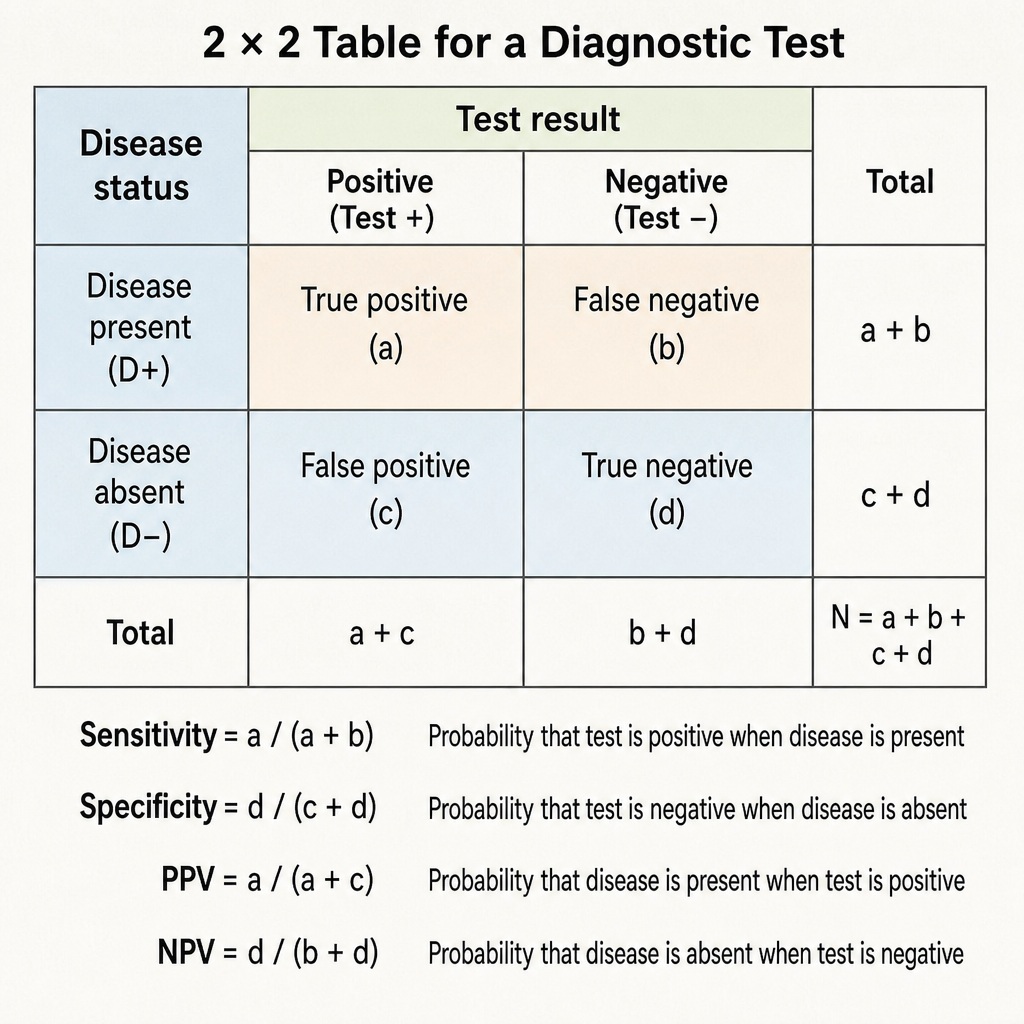
Specificity of a diagnostic test is defined as:
Which of the following is not considered a type of subject bias?
Which of the following best reflects the diagnostic power of a test?
Which one of the following is a good index of the severity of an acute disease?
According to Hill's criteria, which of the following is NOT a criterion for establishing causality in noncommunicable diseases?
Which type of epidemiological study uses a population as the unit of study?
What is the primary purpose of interventional studies in clinical research?
Descriptive epidemiology studies the distribution and determinants of health-related states or events in specified populations. Which of the following best describes the fundamental components of descriptive epidemiology?
The "risk of a disease" is measured by the
What is the death rate among cholera-affected individuals in a population of 5000, where 50 people are affected by cholera, and 10 of these individuals have died?
Explanation: ***0.95*** - **Specificity** is the proportion of individuals without disease who test negative, calculated as **TN/(TN+FP)**. - A specificity of 0.95 (95%) indicates an excellent test that correctly identifies 95% of healthy individuals as negative. *0.05* - This value represents the **false positive rate** (1 - specificity), not specificity itself. - A specificity of 0.05 would mean only 5% of healthy individuals test negative, indicating a very poor test. *0.4* - This value is too low for specificity and could represent other test parameters like **positive predictive value**. - A specificity of 0.4 would incorrectly classify 60% of healthy individuals as positive, making the test clinically unreliable. *0.8* - This value typically represents **sensitivity**, which is the proportion of diseased individuals who test positive. - **Sensitivity** is calculated as **TP/(TP+FN)**, which is different from specificity that focuses on healthy individuals.
Explanation: ***Selection bias*** - **Selection bias** occurs when participants are chosen or remain in a study in a way that introduces a systematic error, leading to a sample that does not accurately represent the target population. - It is a **study design and sampling issue** that occurs at the **recruitment** or **retention stage**, not a bias arising from the subjects' own behavior or reporting. - Unlike subject biases, selection bias is introduced by the **investigators or study methodology**, not by the participants themselves. *Recall bias* - **Recall bias** is a type of **subject bias** where participants differentially remember and report past exposures based on their outcome status. - Subjects with disease may recall exposures more accurately than healthy controls, introducing **systematic error from the subject's memory**. *Hawthorne bias* - **Hawthorne bias** (observer effect) is a **subject bias** where participants modify their behavior because they know they are being studied. - The **subject's awareness** of observation directly influences their actions, responses, or adherence. *Reporting bias* - **Reporting bias** is a **subject bias** where participants selectively disclose or withhold information based on social desirability, embarrassment, or perceived consequences. - This bias arises from the **subject's decision** about what to report.
Explanation: ***Sensitivity and specificity*** - **Diagnostic power of a test** refers to its intrinsic ability to correctly identify individuals with and without disease, which is best reflected by **sensitivity and specificity**. - **Sensitivity** (true positive rate) measures the test's power to detect disease when present - the ability to correctly identify diseased individuals. - **Specificity** (true negative rate) measures the test's power to rule out disease when absent - the ability to correctly identify non-diseased individuals. - These are **inherent properties of the test** that remain constant regardless of disease prevalence in the population, making them the true measures of diagnostic power. - Together, they define how well a test can discriminate between diseased and non-diseased states. *Predictive value of a test* - **Predictive values** (positive and negative) indicate the probability of disease given a test result, but they are measures of **clinical utility**, not diagnostic power. - Predictive values are **dependent on disease prevalence** - the same test with identical sensitivity and specificity will have different predictive values in populations with different disease prevalence. - They answer "Given this result, what is the probability of disease?" rather than measuring the test's inherent diagnostic ability. *Specificity alone* - **Specificity alone** is incomplete as it only measures the test's ability to identify non-diseased individuals. - Diagnostic power requires assessment of both the ability to detect disease (sensitivity) and to rule it out (specificity). *Population attributable risk of a test* - **Population attributable risk (PAR)** is an epidemiological measure that quantifies the proportion of disease in a population attributable to a specific risk factor. - It is not a measure of diagnostic test performance and is unrelated to diagnostic power.
Explanation: ***Case fatality rate*** - The **case fatality rate (CFR)** is the proportion of individuals diagnosed with a disease who die from that disease within a specified time period. - It directly reflects the **virulence** or **severity** of an acute disease by measuring the proportion of fatal outcomes among confirmed cases. *Cause specific death rate* - This measures the **number of deaths** from a specific cause per unit of population during a specified period. - It reflects the **overall burden** of a disease in a population, but not necessarily the severity among those who contract it. *Standardized mortality ratio* - The **standardized mortality ratio (SMR)** compares the observed number of deaths in a study population to the expected number of deaths if the study population had the same age-specific rates as a standard population. - SMR is used to assess the **overall mortality experience** of a group, adjusting for age, but not specifically the severity of an acute disease in affected individuals. *Five year survival* - **Five-year survival rate** is the percentage of people who are still alive five years after being diagnosed with a disease. - It is primarily used for **chronic diseases**, particularly cancers, to assess long-term prognosis rather than the immediate severity of an acute illness.
Explanation: ***Absence of temporal sequence*** - A crucial criterion for establishing causality is the **presence of a temporal sequence**, meaning the exposure must precede the outcome. - The **absence of a temporal sequence** would argue directly against causality, as the cause cannot come after the effect. *Strength of association* - This criterion suggests that a **stronger statistical association** between an exposure and an outcome makes a causal relationship more likely. - A large **relative risk** or **odds ratio** indicates a strong association. *Dose response relationship* - This criterion implies that as the **amount or duration of exposure increases**, the **risk or severity of the outcome also increases**. - This **dose-response gradient** strengthens the argument for a causal link. *Specificity of association* - This criterion suggests that a single exposure leads to a **specific effect**, and not a wide range of unrelated effects. - While helpful, **lack of specificity does not rule out causality**, as many exposures can have multiple effects.
Explanation: ***Correct - Ecological study*** - An **ecological study** examines exposure-outcome relationships by using **data aggregated at the population level**, rather than individual data. - The unit of analysis is a group (e.g., countries, regions, schools), making it ideal for studying population-level trends and associations. *Incorrect - Cohort study* - A **cohort study** follows a group of individuals (the cohort) over time to determine the incidence of a disease or outcome based on their **exposure status**. - The unit of study is the **individual**, observed prospectively or retrospectively. *Incorrect - Case-control study* - A **case-control study** compares individuals with a disease (cases) to individuals without the disease (controls) to identify past **exposures associated with the disease**. - The unit of study is the **individual**, and it is retrospective in nature. *Incorrect - Experimental study* - An **experimental study** (e.g., a randomized controlled trial) involves an **intervention** applied to a group of individuals and compares outcomes with a control group. - The unit of study is typically the **individual** or a small group, with researchers controlling exposure.
Explanation: ***Testing Hypotheses*** - Interventional studies, such as **randomized controlled trials**, are specifically designed to **test cause-and-effect relationships** by actively intervening. - They aim to determine if a specific intervention (e.g., a drug, a therapy) produces a hypothesized outcome. *Confirming Hypotheses* - While interventional studies can confirm hypotheses, their primary role is not just confirmation but the initial **rigorous testing** of a hypothesis under controlled conditions. - Confirmation often implies that previous evidence already strongly supports the hypothesis. *Manipulating Hypotheses* - Hypotheses themselves are not "manipulated"; rather, the **variables** within the study design (e.g., treatment groups, dosages) are manipulated to test the hypothesis. - This option incorrectly applies the concept of manipulation to the hypothesis. *Formulating Hypotheses* - Hypothesis formulation usually occurs during the **observational research phase** or through literature review, *before* interventional studies are designed. - Observational studies or descriptive research are more typically used for generating new hypotheses.
Explanation: ***Person, Place, and Time*** - The core components of **descriptive epidemiology** are **person (who)**, **place (where)**, and **time (when)**, which are essential for understanding disease patterns. - These elements help describe the **distribution of health-related states** or events, forming the basis for further analytical studies. - Together, they constitute the **epidemiological triad** used to characterize disease occurrence. *Place* - While an important component, **place** alone does not encompass all fundamental aspects of descriptive epidemiology. - Understanding where an event occurs must be combined with **who** is affected and **when** it occurs to provide a complete descriptive picture. *Person and Time* - **Person and time** are two crucial components, but they omit the equally important aspect of **place**. - A comprehensive description requires considering **all three dimensions (who, where, when)** for a full understanding of disease distribution. *All of the options* - This option is incorrect because the other individual options (Place alone, or Person and Time) are **incomplete representations** of descriptive epidemiology. - Only the combination of **all three components together** (Person, Place, and Time) represents the fundamental framework of descriptive epidemiology.
Explanation: ***Incidence Rate*** - The **incidence rate** directly measures the frequency of **new cases** of a disease in a population over a specified period. - It is used to estimate the **risk** or probability of developing a disease, as it quantifies how quickly people are contracting the disease within the at-risk population. - **Formula:** (Number of new cases during time period / Population at risk) × multiplier - This is the epidemiologically correct measure of disease risk. *Prevalence Rate* - The **prevalence rate** measures the **total number of existing cases** (both new and old) of a disease in a population at a specific point in time or over a period. - It reflects the **burden** of a disease, not the risk of acquiring it, as it includes individuals who may have developed the disease much earlier. - Prevalence = Incidence × Duration of disease. *Case Fatality Rate* - The **case fatality rate** (CFR) measures the **proportion of individuals diagnosed with a disease who die from that disease** within a specified period. - It reflects the **severity** or lethality of a disease among those affected, not the risk of developing the disease in the first place. - CFR is a measure of disease outcome, not disease occurrence. *Communicability Rate* - There is no standard epidemiological term exactly defined as "communicability rate"; however, related concepts include the **basic reproduction number (R₀)** and **secondary attack rate**. - These concepts describe the **spread or transmissibility of an infectious disease**, not the risk of contracting a disease from a general population perspective. - This measures transmission dynamics rather than individual risk.
Explanation: ***20 per 100*** - The death rate among cholera-affected individuals is also known as the **case fatality rate (CFR)**. - This is calculated as (number of deaths / number of *affected* individuals) × 100 = (10 / 50) × 100 = **20% (or 20 per 100)**. - CFR measures the severity of disease among those who contract it. *1 per 1000* - This would represent a case fatality rate of 0.1%, which is far lower than the actual rate. - This is an incorrect calculation that doesn't match the given data. *5 per 1000* - This would represent a case fatality rate of 0.5%, which is also incorrect. - This calculation does not reflect the proportion of deaths among cholera-affected individuals. *10 per 1000* - This appears to confuse the number of deaths (10) with a rate expression. - The actual **mortality rate** (deaths per total population) would be (10 / 5000) × 1000 = **2 per 1000**, not 10 per 1000. - The question specifically asks for death rate among *affected* individuals (CFR), not the population mortality rate.
Get full access to all questions, explanations, and performance tracking.
Start For Free