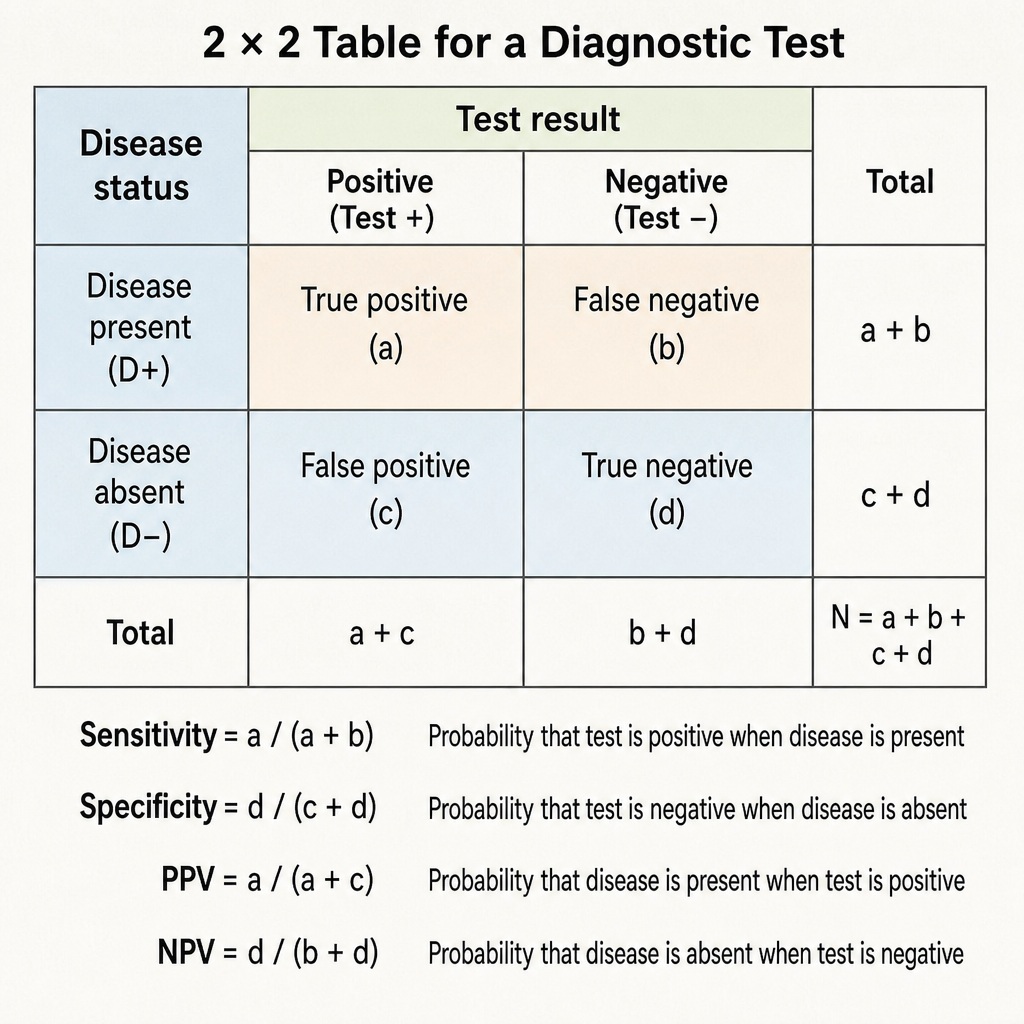
Specificity of a diagnostic test is defined as:
What is the 95% confidence interval for the intraocular pressure (IOP) in the 400 people, given a mean of 25 mm Hg and a standard deviation of 10 mm Hg?
For testing the statistical significance of the difference in heights among different groups of school children, which statistical test would be most appropriate?
All of the following are characteristics of case control study except:
In the context of medical screening, how does a series testing approach affect the net sensitivity and net specificity of the screening methods?
What is the 95% confidence interval in a study with an estimated prevalence of 10% and a sample size of 100, expressed as a percentage range?
STEPwise approach to surveillance for Non-Communicable diseases step 2 is
Most appropriate measure for central tendency when data includes extreme values?
In a village, every fifth house was selected for a study. This is an example of
Which of the following is a non-probability sampling method?
Explanation: ***0.95*** - **Specificity** is the proportion of individuals without disease who test negative, calculated as **TN/(TN+FP)**. - A specificity of 0.95 (95%) indicates an excellent test that correctly identifies 95% of healthy individuals as negative. *0.05* - This value represents the **false positive rate** (1 - specificity), not specificity itself. - A specificity of 0.05 would mean only 5% of healthy individuals test negative, indicating a very poor test. *0.4* - This value is too low for specificity and could represent other test parameters like **positive predictive value**. - A specificity of 0.4 would incorrectly classify 60% of healthy individuals as positive, making the test clinically unreliable. *0.8* - This value typically represents **sensitivity**, which is the proportion of diseased individuals who test positive. - **Sensitivity** is calculated as **TP/(TP+FN)**, which is different from specificity that focuses on healthy individuals.
Explanation: ***24-26*** - This is the correct 95% confidence interval calculated using the formula: **mean ± (Z-score × standard error of the mean)**. - For a 95% confidence interval, the **Z-score is 1.96**. - The **standard error of the mean (SEM)** = standard deviation / √(sample size) = 10 / √400 = 10 / 20 = **0.5**. - Therefore: 25 ± (1.96 × 0.5) = 25 ± 0.98 = **24.02 to 25.98**, which rounds to **24-26**. *22-28* - This interval is too wide for a 95% confidence interval with the given parameters. - An interval of ±3 would correspond to a Z-score of 3/0.5 = 6, which is far beyond the **1.96 required for 95% confidence**. - This would represent a much higher confidence level (>99.9%). *23-27* - This interval is slightly too wide, implying a larger margin of error than calculated. - A range of ±2 would require a Z-score of 2/0.5 = 4 times the SEM, which **overestimates the 95% confidence interval**. - This would correspond to approximately 99.99% confidence. *21-29* - This interval is significantly too wide for a 95% confidence interval. - An interval of ±4 would require a Z-score of 4/0.5 = 8 times the SEM, which would correspond to an **extremely high confidence level** (virtually 100%). - This dramatically exceeds what is needed for 95% confidence.
Explanation: ***ANOVA (Analysis of Variance)*** - **ANOVA** is used to compare the means of **three or more independent groups** simultaneously. In this scenario, you are comparing heights across "different groups" of school children, implying more than two groups. - It tests whether there are any significant differences between the means of these groups, using the **F-statistic**. *Student's t test* - The **Student's t-test** is designed to compare the means of **only two groups**. It would be inappropriate for comparing more than two groups. - Applying multiple t-tests for several groups would increase the risk of **Type I error** (false positive). *chi-square test* - The **chi-square test** is used for analyzing **categorical data** (frequencies or proportions), not for comparing means of continuous data like height. - It determines if there is a significant association between two categorical variables. *Paired 't' test* - A **paired t-test** is used when comparing the means of two related groups or when measurements are taken from the **same subjects at two different times** (e.g., before and after an intervention). - This scenario involves independent groups of children, not paired or repeated measures.
Explanation: ***Correct: Measures incidence rate*** - A **case-control study** proceeds from effect (disease) to cause (exposure) and thus does **NOT measure the incidence rate** of a disease. - Case-control studies calculate **odds ratios**, not incidence rates. - **Incidence rate** is typically measured in **cohort studies**, where a group of individuals is followed over time to observe the development of new cases of a disease. *Incorrect: Quick results are obtained* - Case-control studies are generally **retrospective**, meaning they look back in time from the outcome (disease) to identify past exposures. - This design allows for **quicker data collection** and analysis compared to prospective studies like cohort studies, which follow individuals over time. - This IS a characteristic of case-control studies. *Incorrect: Proceeds from effect to cause* - In a case-control study, researchers start by identifying individuals with the **disease (cases)** and a comparable group without the disease (controls). - They then investigate past exposures in both groups to determine potential **risk factors** or causes. - This IS a characteristic of case-control studies. *Incorrect: Inexpensive study* - Case-control studies are typically **less expensive** than other analytical study designs, such as cohort studies. - This is because they do not require long-term follow-up of a large population, reducing costs associated with repeated measurements and participant retention. - This IS a characteristic of case-control studies.
Explanation: ***Net sensitivity is decreased and net specificity is increased*** - In **series (sequential) testing**, a positive diagnosis requires **ALL tests to be positive**. If any single test is negative, the overall result is negative. - **Net sensitivity DECREASES** because a person with disease must test positive on all tests in the series. If they test negative on even one test, they become a false negative. Formula: Sensitivity_net = Sensitivity₁ × Sensitivity₂ (always lower than individual sensitivities) - **Net specificity INCREASES** because a person without disease needs only ONE negative test result to be correctly classified as negative. Formula: Specificity_net = 1 - [(1-Specificity₁) × (1-Specificity₂)] (always higher than individual specificities) - **Series testing is used when high specificity is needed** (to rule IN disease, confirm diagnosis, minimize false positives) *Net sensitivity is increased and net specificity is decreased* - This describes **parallel (simultaneous) testing**, not series testing - In parallel testing, a positive result on **ANY test** leads to positive diagnosis - Parallel testing increases sensitivity (catches more true positives) but decreases specificity (more false positives) - Parallel testing is used for screening when you don't want to miss cases *Net sensitivity and net specificity are both increased* - This is **mathematically impossible** in real-world testing scenarios - Sensitivity and specificity have an inverse relationship - improving one typically decreases the other - No testing strategy (series or parallel) can simultaneously increase both parameters above individual test values *Net sensitivity remains the same and net specificity is increased* - This is incorrect because series testing **always affects both** sensitivity and specificity - The multiplicative nature of series testing means sensitivity must decrease when multiple tests are required to be positive - You cannot maintain sensitivity while requiring agreement across multiple tests
Explanation: ***4% to 16%*** - To calculate the 95% **confidence interval** for a **proportion**, we use the formula: p ± 1.96 * sqrt((p * (1-p)) / n). - Given a prevalence (**p**) of 0.10 and a **sample size** (**n**) of 100, the standard error is sqrt((0.10 * 0.90) / 100) = sqrt(0.0009) = 0.03. - The 95% confidence interval is 0.10 ± (1.96 * 0.03), which is 0.10 ± 0.0588. This translates to a range of 0.0412 to 0.1588, or approximately **4% to 16%**. *Inadequate information to calculate 95% CI* - The necessary information, including **prevalence** (10%) and **sample size** (100), is provided in the question. - With these two **parameters**, the 95% confidence interval can be calculated using standard statistical formulas. *6% to 16%* - This range is too narrow and suggests a smaller **standard error** or a different **confidence level**. - The correct calculation based on the provided **prevalence** and **sample size** yields a wider interval. *5% to 15%* - This range, while plausible, is slightly narrower than the **calculated interval**. - The use of the standard formula for a **proportion** with the given values results in a lower bound closer to 4% and an upper bound closer to 16%.
Explanation: ***Physical measurement*** - The **STEPwise approach** to NCD surveillance involves three steps, with Step 2 specifically focusing on **physical measurements**. - This step includes measurements like **blood pressure**, BMI, weight, height, and waist circumference, which provide crucial data on NCD risk factors. *Biochemical Measurement* - This is typically **Step 3** in the WHO STEPwise approach, focusing on biological measurements from blood or urine samples. - Examples include **blood glucose**, cholesterol levels, and other biomarkers. *Behavioral measurement* - This corresponds to **Step 1** of the WHO STEPwise approach, which involves self-reported data on lifestyle factors. - It covers aspects like **diet**, physical activity, and tobacco/alcohol consumption. *Emotional Assessment* - While emotional and mental health are relevant to overall well-being, **emotional assessment** is not a standard, distinct step in the core WHO STEPwise approach for NCD surveillance. - The STEPs focus on behavioral, physical, and biochemical indicators of NCD risk.
Explanation: ***Median*** - The **median** is less affected by **extreme values** or **outliers** because it represents the middle value in an ordered dataset. - It provides a more robust measure of central tendency when the data distribution is **skewed**. *Mode* - The **mode** represents the most frequently occurring value in a dataset; it does not account for the magnitude of other values. - While it is not influenced by extreme values, it may not accurately represent the central tendency of a continuous dataset, especially if there are **multiple modes** or if the most frequent value is not central. *Mean* - The **mean** is calculated by summing all values and dividing by the number of values, making it highly susceptible to **extreme values** or **outliers**. - A single very large or very small value can significantly distort the mean, pulling it away from the true center of most data points. *Geometric mean* - The **geometric mean** is primarily used for data that is **multiplicative** in nature or when dealing with rates of change, or positively skewed distributions. - While it can be less sensitive to extreme values than the arithmetic mean for certain types of data, it is not the most appropriate general measure for central tendency when outliers are present without specific multiplicative contexts.
Explanation: ***Systematic random sampling*** - This method involves selecting subjects from a **ordered sampling frame** at regular intervals, such as every k-th item. - In this scenario, selecting every fifth house represents a fixed interval (k=5), which is characteristic of systematic random sampling. *Simple random sampling* - This method ensures that every member of the population has an **equal chance of being selected**, often through random number generation. - It does not involve a predetermined, fixed interval of selection from an ordered list. *Convenience sampling* - This technique involves selecting subjects who are **easily accessible or readily available**, without any systematic or random process. - It is prone to bias as it does not represent the entire population. *Stratified random sampling* - This method involves dividing the population into **homogeneous subgroups (strata)** and then conducting simple random sampling within each stratum. - The scenario does not describe dividing the village households into distinct subgroups before selection.
Explanation: ***Quota sampling*** - In **quota sampling**, researchers select participants based on specific characteristics (e.g., age, gender, ethnicity) to ensure the sample reflects the population proportions of these characteristics. - This method is **non-probability** because the selection of individuals within each quota is not random, and not every member of the population has an equal chance of being selected. *Simple random sampling* - **Simple random sampling** is a **probability sampling method** where every member of the population has an equal and independent chance of being selected. - This is typically achieved through random number generators or drawing names from a hat. *Systematic random sampling* - **Systematic random sampling** is a **probability sampling method** where sample members are selected at regular intervals from a list of the population. - The starting point is chosen randomly, but subsequent selections follow a predetermined pattern, ensuring a systematic, yet random, selection. *Cluster sampling* - **Cluster sampling** is a **probability sampling method** where the population is divided into naturally occurring groups (clusters), and then a random sample of these clusters is chosen. - Once clusters are selected, all individuals within the chosen clusters, or a random sample of individuals from them, are included in the study.
Get full access to all questions, explanations, and performance tracking.
Start For Free