APGAR scores of 30 children are recorded in a hospital, and most of the readings are found to be 7 or above. What can be inferred about this data distribution?
What is the 95% confidence interval for the intraocular pressure (IOP) in the 400 people, given a mean of 25 mm Hg and a standard deviation of 10 mm Hg?
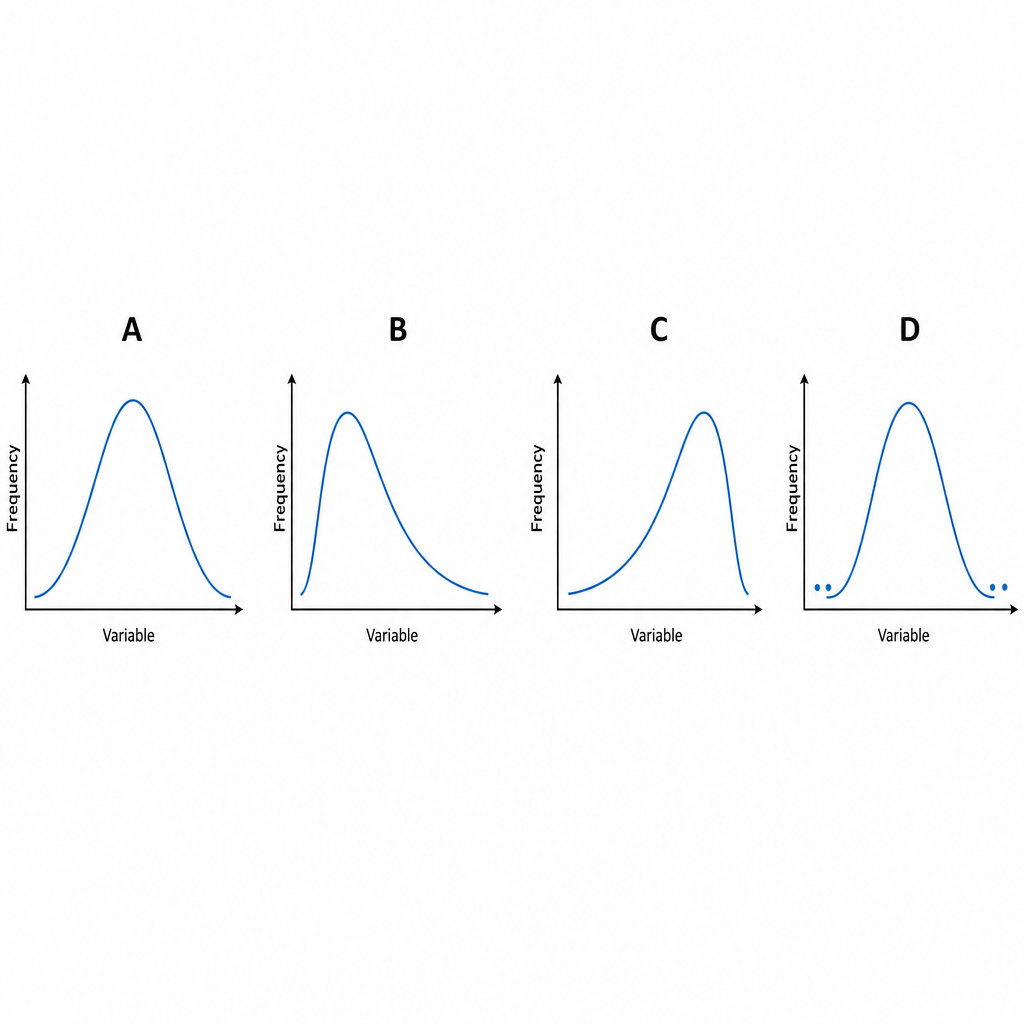
For a positively skewed curve, which measure of central tendency is largest?
What is the shape of a normal distribution curve?
A study is performed to assess the intelligence quotient and the crime rate in a neighborhood. Students at a local high school are given an assessment and their criminal and disciplinary records are reviewed. One of the subjects scores 2 standard deviations over the mean. What percent of students did he score higher than?
In a normal distribution, one standard deviation from the mean includes approximately:
Which one of the following tests should be applied to compare mean haemoglobin level of two groups of antenatal mothers?
In a normal distribution, Mean ± 2 S.D. contains
In the estimation of statistical probability, Z score is applicable to:
Which of the following statements is true for a left-skewed distribution?
Explanation: ***Negatively skewed data*** - A distribution is **negatively skewed** when the bulk of the data is concentrated at the **higher end** of the scale - In this case, most **APGAR scores are 7 or above** (out of maximum 10), indicating a **left-skewed or negatively skewed distribution** - The tail of the distribution extends toward the **lower values**, while the peak is at the **higher end** - In negatively skewed data: **Mean < Median < Mode** *Positively skewed data* - **Positively skewed data** would imply that most APGAR scores were at the **lower end** of the scale, with a tail extending toward higher values - This is contrary to the observation that most scores are 7 or above - In positively skewed data: **Mode < Median < Mean** *Normal distribution* - A **normal distribution** implies a **symmetrical bell-shaped curve** where data is evenly distributed around the mean - The description "most readings are 7 or above" clearly indicates an **asymmetrical distribution**, not a normal one - In normal distribution: **Mean = Median = Mode** *Symmetrical data* - **Symmetrical data** means the distribution is balanced, with equal spread on both sides of the center - The given condition that most readings are at the **higher end (7 or above)** signifies an **imbalance**, ruling out symmetry
Explanation: ***24-26*** - This is the correct 95% confidence interval calculated using the formula: **mean ± (Z-score × standard error of the mean)**. - For a 95% confidence interval, the **Z-score is 1.96**. - The **standard error of the mean (SEM)** = standard deviation / √(sample size) = 10 / √400 = 10 / 20 = **0.5**. - Therefore: 25 ± (1.96 × 0.5) = 25 ± 0.98 = **24.02 to 25.98**, which rounds to **24-26**. *22-28* - This interval is too wide for a 95% confidence interval with the given parameters. - An interval of ±3 would correspond to a Z-score of 3/0.5 = 6, which is far beyond the **1.96 required for 95% confidence**. - This would represent a much higher confidence level (>99.9%). *23-27* - This interval is slightly too wide, implying a larger margin of error than calculated. - A range of ±2 would require a Z-score of 2/0.5 = 4 times the SEM, which **overestimates the 95% confidence interval**. - This would correspond to approximately 99.99% confidence. *21-29* - This interval is significantly too wide for a 95% confidence interval. - An interval of ±4 would require a Z-score of 4/0.5 = 8 times the SEM, which would correspond to an **extremely high confidence level** (virtually 100%). - This dramatically exceeds what is needed for 95% confidence.
Explanation: ***Mean*** - In a **positively skewed distribution**, the tail of the distribution extends towards higher values, pulling the **mean** in that direction, making it the largest among the three measures of central tendency. - The presence of **outliers** with large values in the tail disproportionately increases the mean. *Mode* - The **mode** represents the most frequently occurring value in the data set. - In a positively skewed distribution, the mode will be located at the **peak of the distribution**, which is typically the smallest value among the three measures of central tendency. *All are equal* - This statement is characteristic of a **perfectly symmetrical distribution** (e.g., a normal distribution), where the **mean, median, and mode** are all equal. - A positively skewed curve is asymmetrical, meaning these measures will not be equal. *Median* - The **median** is the middle value in an ordered data set, dividing the data into two equal halves. - In a positively skewed distribution, the median will be shifted towards the right of the mode but will still be to the left of the mean, meaning it is **smaller than the mean**.
Explanation: ***Bell-shaped*** - A **normal distribution** is a **symmetric probability distribution** centered around its mean, with tails that taper off indefinitely. - The distinctive shape resembles a **bell**, with the highest point at the mean and gradually decreasing frequencies as values move away from the mean. *J-shaped* - A **J-shaped curve** typically describes a distribution where the frequency is highest at one end and then continuously decreases or increases to the other end. - This shape is not characteristic of the **symmetry** and **central tendency** observed in a normal distribution. *U-shaped* - A **U-shaped curve** indicates that frequencies are highest at both ends of the distribution and lowest in the middle. - This is the opposite of a **normal distribution**, where the highest frequency is at the center (mean). *None of the options* - The term **bell-shaped** accurately describes a normal distribution curve, making this option incorrect.
Explanation: ***97.5%*** - This question relates to the **normal distribution (bell curve) and the empirical rule (68-95-99.7 rule)** [1]. - A score 2 standard deviations above the mean means that 95% of the data falls within +/- 2 standard deviations of the mean [2]. This leaves 5% outside of this range (2.5% on each tail). Therefore, the student scored higher than 95% + 2.5% = **97.5%** of students. *95%* - This percentage represents the data that falls within **2 standard deviations of the mean (both sides)**, not the percentage a score 2 standard deviations above the mean is higher than [1]. - It would be correct if the question asked for the percentage of students whose scores fall within two standard deviations of the mean. *68%* - This percentage represents the data that falls within **1 standard deviation of the mean** according to the empirical rule [1]. - A score 2 standard deviations above the mean is significantly higher than this range. *99.7%* - This percentage represents the data that falls within **3 standard deviations of the mean (both sides)**, according to the empirical rule [2]. - This would mean the student scored 3 standard deviations above the mean, which is not stated in the question.
Explanation: ***68% of the data*** - In a **normal distribution** (bell curve), approximately **68%** of the data falls within **one standard deviation** of the mean. - This is a fundamental property of the **empirical rule** (or 68-95-99.7 rule) for normal distributions. *50% of the data* - **50%** of the data in a normal distribution lies below the **mean**, or within the **interquartile range** if measured from median. - It does not represent the data encompassed by one standard deviation from the mean. *95% of the data* - Approximately **95%** of the data in a normal distribution falls within **two standard deviations** of the mean. - This is another key part of the **empirical rule**, but it refers to a larger range than one standard deviation. *100% of the data* - While theoretically all data points of a continuous distribution are contained somewhere, **100%** of the data is not practically enclosed within a finite number of standard deviations in a true normal distribution. - Virtually all (e.g., 99.7%) of the data falls within **three standard deviations**, but 100% is usually considered to span an infinite range.
Explanation: ***Unpaired t-Test*** - The **unpaired t-test** is used to compare the means of **two independent groups** on a continuous variable, such as hemoglobin levels. - Antenatal mothers in two distinct groups are independent, and **hemoglobin level is a continuous variable**, making this the appropriate choice. *Analysis of variance* - **ANOVA** (Analysis of Variance) is used to compare the means of **three or more independent groups**. - Since there are only **two groups** being compared, ANOVA is not the most efficient or appropriate test. *Chi-square test* - The **Chi-square test** is used to analyze the association between **two categorical variables**. - Hemoglobin level is a **continuous variable**, not categorical, so this test is not suitable for comparing means. *Paired t-test* - The **paired t-test** is used to compare the means of **two related groups** or the same group measured at two different times (e.g., before and after an intervention). - The two groups of antenatal mothers are **independent**, not paired or related.
Explanation: ***95.4 % values*** - According to the **empirical rule** (or 68-95-99.7 rule) for normal distributions, approximately **95.4%** of data falls within two standard deviations of the mean. - This interval covers from (Mean - 2 S.D.) to (Mean + 2 S.D.) and represents the likelihood of a value falling in this range. *68.3 % values* - This percentage corresponds to the data contained within **Mean ± 1 S.D.** in a normal distribution, not Mean ± 2 S.D. - It signifies that roughly two-thirds of all observations lie within one standard deviation from the mean in a bell-shaped curve. *91.2 % values* - This value is not a standard percentage associated with common multiples of standard deviations (1, 2, or 3) from the mean in a normal distribution. - It does not correspond to any universally recognized interval like ±1 S.D., ±2 S.D., or ±3 S.D. *99.7 % values* - This percentage represents the data contained within **Mean ± 3 S.D.** in a normal distribution. - It indicates that almost all (99.7%) of the data points are expected to fall within three standard deviations from the mean.
Explanation: ***Normal distribution*** - The **Z-score** (or standard score) is a measure of how many **standard deviations** an element is from the mean. It is specifically used when working with **normally distributed data**. - It allows for the comparison of scores from different normal distributions by standardizing them to a common scale. *Poisson distribution* - This distribution deals with the **number of events** occurring in a fixed interval of time or space, given a known average rate, and is not typically used with Z-scores directly. - It is a **discrete probability distribution**, unlike the continuous nature required for direct Z-score application. *Skewed distribution* - A skewed distribution has an **asymmetrical shape**, where points cluster more on one side of the mean. - Z-scores can be calculated for skewed distributions, but their interpretation as probabilities (e.g., using a standard normal table) is **not valid** because the data do not follow a bell-shaped curve. *Binomial distribution* - This distribution describes the **number of successes** in a fixed number of independent Bernoulli trials. - It is a **discrete probability distribution** and generally, Z-scores are not directly applied to it, although for a large number of trials, it can be approximated by a normal distribution.
Explanation: ***Median > Mean*** - In a **left-skewed distribution**, the bulk of the data is on the right, and the tail extends to the left, pulling the **mean** towards the lower values. - This pull results in the **mean** being less than the **median**, which is less affected by extreme values in the tail. *Mean = Median* - This relationship holds true for a **symmetrical distribution**, such as a **normal distribution**, where the data is evenly distributed around the center. - In a **skewed distribution**, the mean and median will diverge due to the presence of outliers or extreme values on one side. *Mean>Mode* - This statement is characteristic of a **right-skewed distribution**, where the tail extends to the right, pulling the **mean** to a higher value than the **mode**. - In a right-skewed distribution, typically **mode < median < mean**. *Mean < Mode* - This statement indicates that the **mode** (the most frequent value) is greater than the **mean**, which is not a defining characteristic of a left-skewed distribution. - While it can occur, the primary relationship for left-skewness is **mean < median**.
Get full access to all questions, explanations, and performance tracking.
Start For Free