All (119)Anatomy (1)Anesthesiology (1)Biochemistry (2)Community Medicine (30)ENT (1)General Medicine (2)Internal Medicine (6)Microbiology (1)Obstetrics and Gynecology (38)Ophthalmology (2)Orthopaedics (1)Pathology (4)Pediatrics (2)Pharmacology (5)Physiology (2)Radiology (2)Surgery (19)
Q81
Physical Quality of life consolidates which of the following indicators? 1. Infant Mortality Rate 2. Life expectancy at birth 3. Literacy 4. Per capita income 5. Mean years of schooling 6. Life expectancy at age one Select the correct answer using the code given below:
Q82
The sequence of events leading to disability and handicap is:
Q83
Which one of the following statements is NOT true for taking a decision on screening for disease?
Q84
In a case-control study, 300 women aged 20-45 years suffering from breast cancer were compared with age-matched 300 women without breast cancer. It was observed that 120 women among cases and 60 women among controls were obese. The odds ratio of developing breast cancer among obese women is:
Q85
Standardized Mortality ratio is best explained by which one of the following statements?
Q86
In a family of six (2 parents and 4 children), the youngest child catches measles infection. The parents are immune to the infection. On 3rd and 5th day of the infection of the first child, the two other children also suffer from measles. The secondary attack rate (SAR) of measles is:
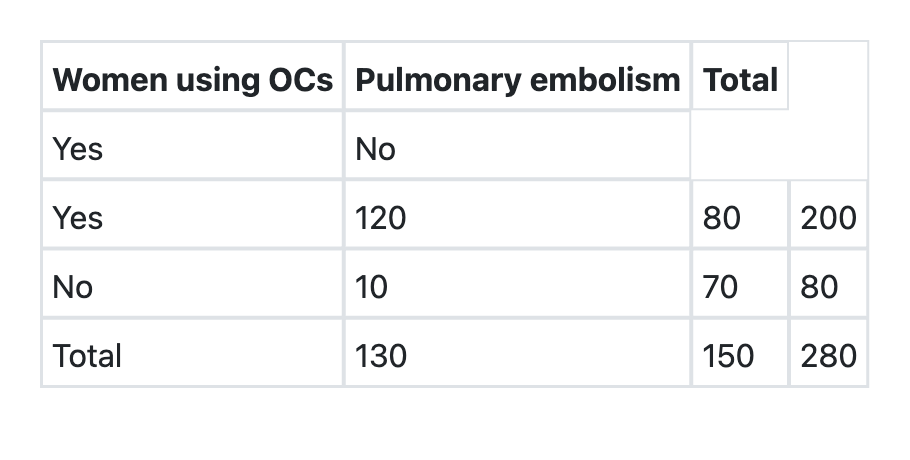
Q87
What is the relative risk of developing pulmonary embolism in users of oral contraceptives as per the information given below?
Q88
Which one of the following epidemiologic methods can be used to identify risk factors and estimate the degree of risk?
Q89
Which one of the following tests should be applied to compare mean haemoglobin level of two groups of antenatal mothers?