NEET-PG 2017 — Physiology
14 Previous Year Questions with Answers & Explanations
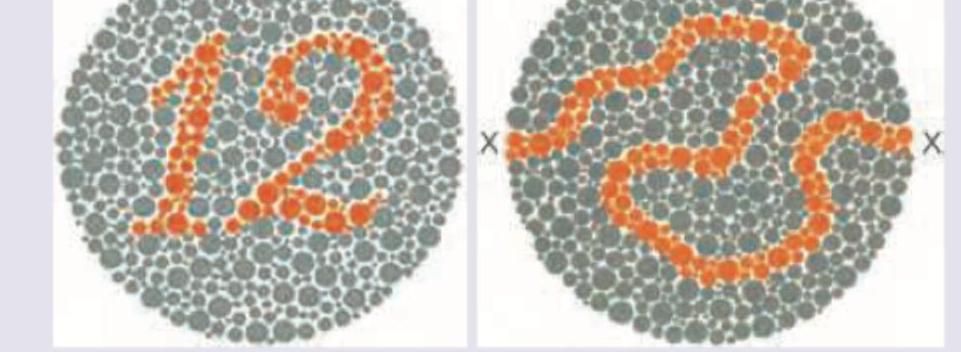
Which of the following cells in the brain are responsible for handling information regarding ability to read the slide below? (Recent NEET Pattern 2016-17)
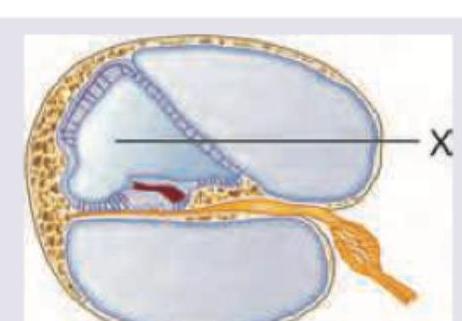
What is correct about the composition of fluid in the area marked as X?
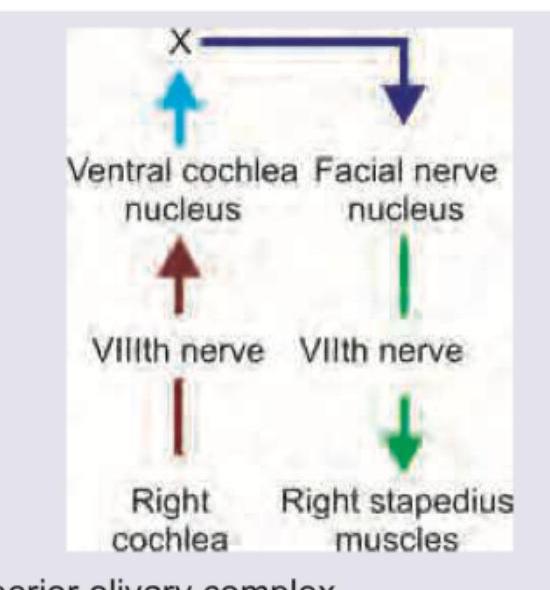
The image given below shows stapedial reflex. What does ' $X$ ' denote?
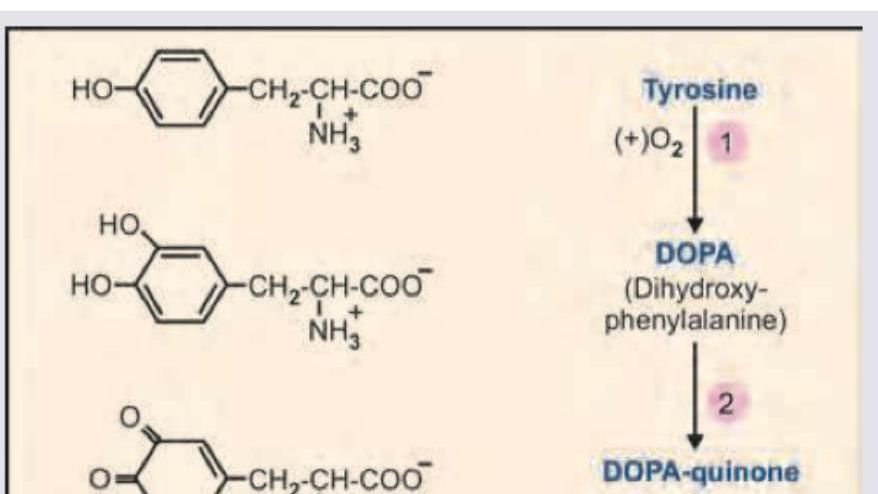
Name the product marked as X in the image shown below:
Which of the following will occur on efferent arteriolar constriction?
The A wave in His bundle electrogram shows presence of:
Which of the following is correct about the pressure volume loop of left ventricle?
Which of the following is correct about the point marked $Z$ on the cardiac cycle?
The pressure-volume loop of left ventricle tracing of the patient indicates:
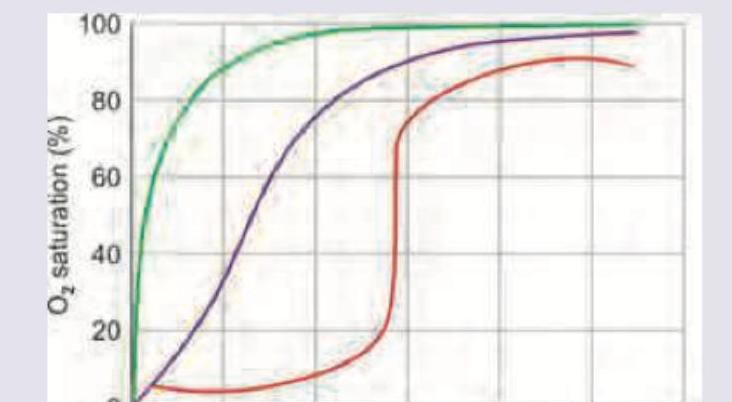
Which of the following dissociation curve mentioned is for myoglobin?
NEET-PG 2017 - Physiology NEET-PG Practice Questions and MCQs
Question 1: Which of the following cells in the brain are responsible for handling information regarding ability to read the slide below? (Recent NEET Pattern 2016-17)
- A. Magnocellular cells
- B. Parvocellular cells (Correct Answer)
- C. Purkinje cells
- D. Pyramidal cells
Explanation: ***Parvocellular cells*** - **Parvocellular cells** (P-cells) are responsible for processing detailed visual information, including **color**, **form**, and fine **texture**. Reading the Ishihara test requires the ability to distinguish specific colors and fine patterns. - They have **small receptive fields** and transmit information about high spatial resolution and chromatic detail, crucial for tasks such as reading and recognizing fine visual cues. *Magnocellular cells* - **Magnocellular cells** (M-cells) are primarily involved in detecting **motion** and processing **low-spatial frequency information**, such as global shape and location. - They have **large receptive fields** and are not primarily responsible for detailed color or pattern discrimination needed for reading. *Purkinje cells* - **Purkinje cells** are a type of large, extensively branched neuron located in the **cerebellar cortex**. - Their primary function is motor coordination, balance, and motor learning, not visual processing or reading. *Pyramidal cells* - **Pyramidal cells** are excitatory neurons found in the cerebral cortex and hippocampus, characterized by their pyramidal-shaped cell bodies. - While they are involved in complex cognitive functions, including parts of visual perception, they are not the specific cells in the primary visual pathway responsible for initial processing of fine details and color as required for reading this type of visual test.
Question 2: What is correct about the composition of fluid in the area marked as X?
- A. Na = 150 mEq/L, K = 3 mEq/L, Chloride = 125 mEq/L
- B. Na = 152 mEq/L, K = 30 mEq/L, Chloride = 125 mEq/L
- C. Na = 50 mEq/L, K = 30 mEq/L, Chloride = 125 mEq/L
- D. Na = 3 mEq/L, K = 150 mEq/L, Chloride = 125 mEq/L (Correct Answer)
Explanation: ***Na = 3 mEq/L, K = 150 mEq/L, Chloride = 125 mEq/L*** - The area marked as X points to the **endolymph** within the scala media of the cochlea, which has a unique high **potassium concentration** (~150 mEq/L) and low **sodium concentration** (~3 mEq/L). - This composition is maintained by the **stria vascularis** and is essential for proper **hair cell function** and hearing transduction. - The high K⁺/low Na⁺ ratio creates the **endocochlear potential** (+80 mV) necessary for cochlear amplification. *Na = 150 mEq/L, K = 3 mEq/L, Chloride = 125 mEq/L* - This represents typical **extracellular fluid** or **perilymph** composition with high sodium and low potassium, which is the opposite of endolymph. - The **perilymph** is found in the scala vestibuli and scala tympani, not in the area marked as X (scala media). *Na = 152 mEq/L, K = 30 mEq/L, Chloride = 125 mEq/L* - The sodium level is too high and potassium too low to represent **endolymph**, which requires an extreme K⁺/Na⁺ gradient for proper cochlear function. - These intermediate values don't match any specific **cochlear fluid compartment** and would not support normal hearing. *Na = 50 mEq/L, K = 30 mEq/L, Chloride = 125 mEq/L* - Both sodium and potassium levels are insufficient to create the **electrochemical gradient** necessary for cochlear hair cell depolarization. - These values don't correspond to either **endolymph** or **perilymph** compositions found in the inner ear.
Question 3: The image given below shows stapedial reflex. What does ' $X$ ' denote?
- A. Superior olivary complex (Correct Answer)
- B. Medial geniculate body
- C. Superior colliculus
- D. Lateral lemniscus
Explanation: ***Superior olivary complex*** - The image depicts the neural pathway for the **stapedial reflex**, where sound input from the cochlea is processed, and the signal travels to the superior olivary complex. - From the superior olivary complex (labeled 'X'), signals project to the **facial nerve nucleus**, which then innervates the **stapedius muscle** to contract and dampen sound. *Medial geniculate body* - The medial geniculate body is part of the **thalamus** and is involved in processing auditory information before it reaches the auditory cortex. - It is a more rostral structure in the auditory pathway and is not directly involved in the brainstem reflex arc of the stapedius reflex at the labeled point 'X'. *Superior colliculus* - The superior colliculus is primarily involved in **visual reflexes** and directing gaze towards salient stimuli. - Although it has some multimodal sensory integration, it is not a key relay in the auditory pathway for the stapedial reflex. *Lateral lemniscus* - The lateral lemniscus is an **ascending auditory pathway** in the brainstem, carrying information from the cochlear nuclei and superior olivary complex to higher centers like the inferior colliculus. - While it carries auditory signals, "X" represents a more specific processing center (superior olivary complex) that integrates bilateral auditory input and projects to motor nuclei for acoustic reflexes.
Question 4: Name the product marked as X in the image shown below:
- A. Indolequinone (Correct Answer)
- B. Tetrabenazine
- C. Homovanillic acid
- D. Kynurenine
Explanation: ***Indolequinone*** - The image depicts the **melanin biosynthesis pathway** starting from **tyrosine**. - Tyrosine is converted to **L-DOPA** by tyrosinase, which is then oxidized to **dopaquinone** (also called DOPA-quinone). - Dopaquinone undergoes intramolecular cyclization to form **leucodopachrome**, which is subsequently oxidized to **dopachrome**. - Dopachrome is then converted through a series of steps to **5,6-dihydroxyindole**, which is finally oxidized to **indole-5,6-quinone** (indolequinone). - **Indolequinone** is a key intermediate that polymerizes to form **melanin**, the pigment responsible for coloration in skin, hair, and eyes. - Based on the pathway shown, X represents indolequinone, an oxidized indole derivative in melanin synthesis. *Tetrabenazine* - **Tetrabenazine** is a pharmaceutical drug that inhibits **vesicular monoamine transporter 2 (VMAT2)**. - It is used therapeutically to treat hyperkinetic movement disorders such as **Huntington's disease** and tardive dyskinesia. - It is not a natural metabolic intermediate in the tyrosine-to-melanin biosynthetic pathway. *Homovanillic acid* - **Homovanillic acid (HVA)** is a major end metabolite of **dopamine** in the catecholamine degradation pathway. - It is formed by the sequential actions of **monoamine oxidase (MAO)** and **catechol-O-methyltransferase (COMT)** on dopamine. - This represents a completely different branch of tyrosine metabolism (catecholamine pathway), not the melanin synthesis pathway. *Kynurenine* - **Kynurenine** is an intermediate metabolite in the **kynurenine pathway**, which is the major route of **tryptophan** degradation. - The kynurenine pathway leads to the formation of NAD+ and various neuroactive metabolites. - This pathway is completely separate from tyrosine metabolism and is unrelated to the melanin synthesis pathway shown in the image.
Question 5: Which of the following will occur on efferent arteriolar constriction?
- A. Increased GFR (Correct Answer)
- B. Decreased GFR
- C. Increase flow in vasa recta
- D. Decreased flow in vasa recta
Explanation: ***Increased GFR*** - **Efferent arteriolar constriction** increases resistance to blood flow out of the glomerulus, causing blood to 'back up' and increase the **glomerular hydrostatic pressure (PGC)** - Higher **glomerular hydrostatic pressure** leads to increased net filtration pressure, which directly results in **increased glomerular filtration rate (GFR)** - This is the **primary and most clinically significant effect** of efferent arteriolar constriction - The increased PGC helps maintain GFR even when renal blood flow decreases slightly *Decreased GFR* - This is incorrect because **efferent arteriolar constriction** increases glomerular hydrostatic pressure, thereby **increasing GFR**, not decreasing it - Only severe efferent constriction that critically reduces renal plasma flow would eventually decrease GFR - The immediate and primary effect is always an increase in GFR *Increase flow in vasa recta* - This is incorrect; **efferent arteriolar constriction** actually **decreases** flow to the vasa recta - The constriction reduces blood flow exiting the glomerulus, which means less blood reaches the downstream peritubular capillaries and vasa recta - This decreased perfusion of the vasa recta can enhance urine concentration by reducing washout of the medullary concentration gradient *Decreased flow in vasa recta* - While this is physiologically true (efferent constriction does reduce peritubular and vasa recta blood flow), it is **not the primary or most significant effect** being tested - In the context of efferent arteriolar constriction, the **increased GFR** is the dominant and most clinically relevant consequence - The question asks "which will occur" expecting the primary hemodynamic effect on glomerular function - Decreased vasa recta flow is a secondary consequence, whereas increased GFR is the direct and immediate result
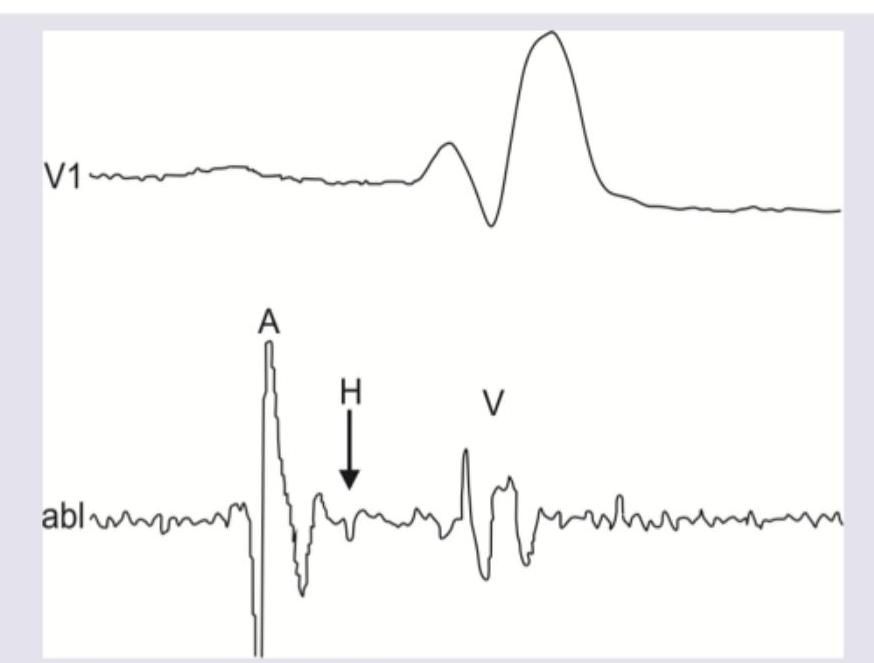
Question 6: The A wave in His bundle electrogram shows presence of:
- A. Atrial depolarization (Correct Answer)
- B. Atrial repolarization
- C. AV node activation
- D. Atrial depolarization to AV node activation
Explanation: ***Atrial depolarization*** - The **A wave** in a His bundle electrogram represents the electrical activity corresponding to **atrial depolarization**. This is the first electrical event recorded prior to ventricular activation. - It signifies the activation of the atria, preceding the impulse transmission through the AV node and His bundle. *Atrial repolarization* - **Atrial repolarization** is generally not clearly visible as a distinct wave in a His bundle electrogram, as its electrical signal is usually small and often obscured by the much larger QRS complex from ventricular depolarization. - The T-wave on a surface ECG corresponds to ventricular repolarization, and there isn't a directly analogous, easily identifiable wave for atrial repolarization in standard His bundle recordings. *AV node activation* - **AV node activation** itself is a slow electrical process that does not generate a distinct, sharply defined wave in the His bundle electrogram. - The time taken for conduction through the AV node is represented by the **AH interval**, which is the duration between the A wave (atrial activation) and the H wave (His bundle activation). *Atrial depolarization to AV node activation* - This option describes a **duration or interval**, specifically the **AH interval**, which reflects the time from the beginning of atrial activation (A wave) to the beginning of His bundle activation (H wave) and primarily represents AV nodal conduction. - The A wave itself signifies a specific electrical event (**atrial depolarization**), not the entire period from atrial depolarization up to AV node activation.
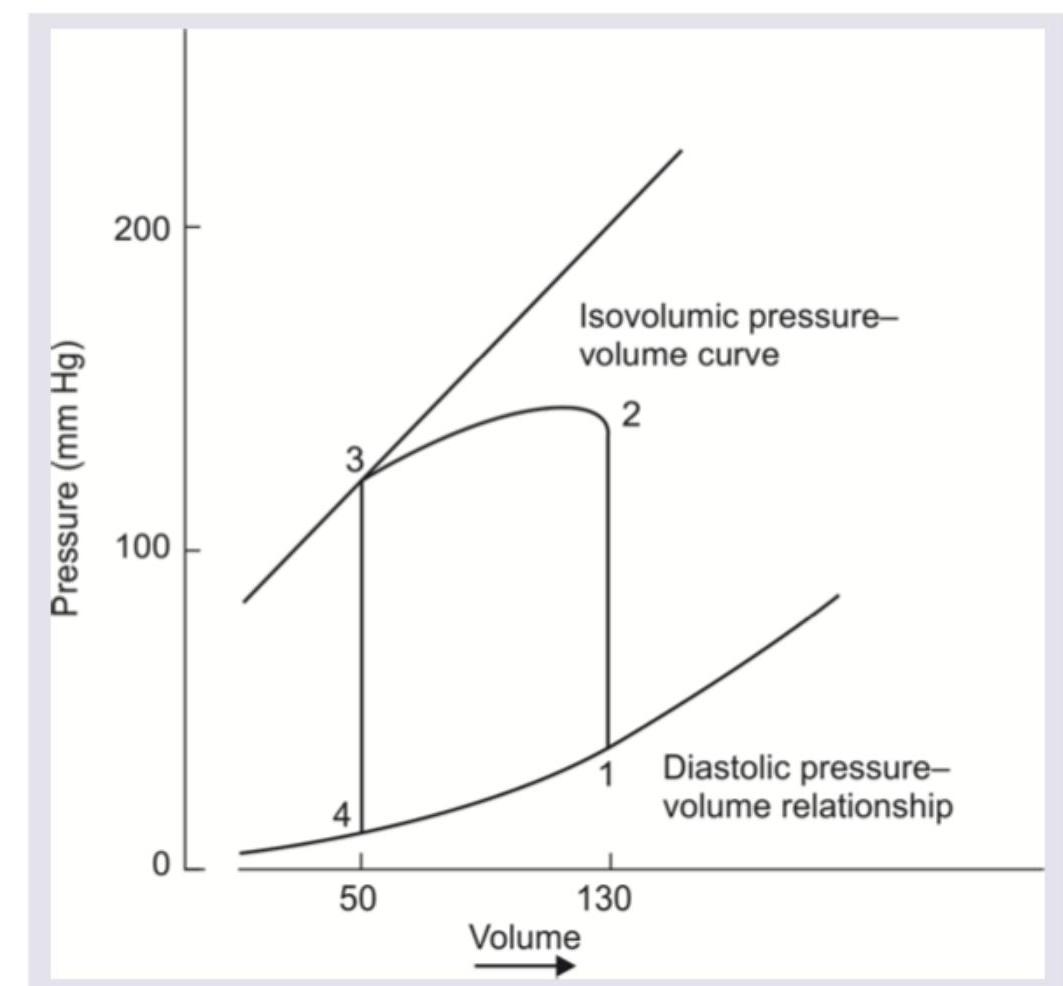
Question 7: Which of the following is correct about the pressure volume loop of left ventricle?
- A. 1 to 2 indicates isovolumetric relaxation
- B. 2 to 3 indicates ventricular diastole
- C. Aortic valve opens at 2 (Correct Answer)
- D. Pulmonic valve opens at 3
Explanation: ***Aortic valve opens at 2*** - Point 2 marks the moment when **left ventricular pressure exceeds aortic pressure**, causing the aortic valve to open. - This is the transition point between **isovolumetric contraction** (1→2) and **ventricular ejection** (2→3). - From point 2 onwards, blood is actively ejected from the left ventricle into the aorta during **systole**. *1 to 2 indicates isovolumetric relaxation* - The phase from point 1 to point 2 shows an increase in **pressure at constant volume**, which represents **isovolumetric contraction**, not relaxation. - During **isovolumetric contraction**, both the mitral and aortic valves are closed, and the ventricle contracts without changing volume, building up pressure. - **Isovolumetric relaxation** occurs from point 3 to point 4, where pressure drops at constant volume after the aortic valve closes. *2 to 3 indicates ventricular diastole* - The period from point 2 to point 3 represents **ventricular ejection**, which is part of **ventricular systole**, not diastole. - During this phase, the aortic valve is open, and blood is being ejected from the left ventricle into the aorta while ventricular volume decreases. - **Ventricular diastole** includes isovolumetric relaxation (3→4) and ventricular filling (4→1). *Pulmonic valve opens at 3* - Point 3 represents the **closure of the aortic valve** at the end of ventricular ejection, not its opening. - The **pulmonic valve** is part of the right ventricular circuit, not the left ventricle; it opens during right ventricular ejection into the pulmonary artery. - This question specifically addresses the **left ventricular** pressure-volume loop.
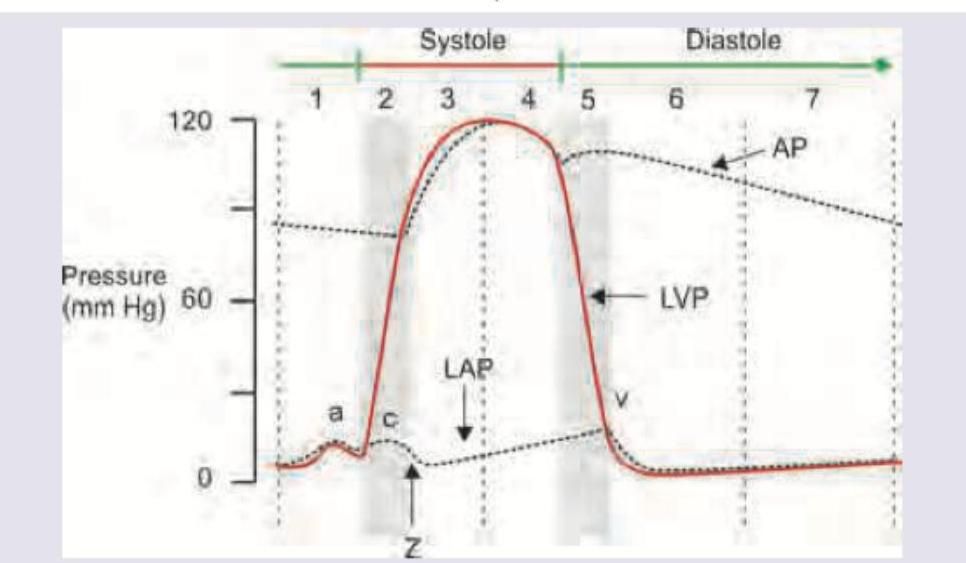
Question 8: Which of the following is correct about the point marked $Z$ on the cardiac cycle?
- A. Mitral valve opens
- B. Tricuspid valve opens
- C. Aortic valve opens (Correct Answer)
- D. Mid systolic click
Explanation: ***Aortic valve opens*** - At point Z, the **left ventricular pressure (LVP)** curve (solid red line) intersects and surpasses the **aortic pressure (AP)** curve (dashed line), marking the moment the **aortic valve opens** and blood begins to be ejected into the aorta. - This event signifies the transition from **isovolumetric contraction** to rapid **ventricular ejection phase** during systole. *Mitral valve opens* - The **mitral valve opens** during diastole, when the **left ventricular pressure (LVP)** falls below the **left atrial pressure (LAP)**, allowing ventricular filling. - This event would typically occur much later in the cardiac cycle, around point 5 or 6, after the aortic valve closes. *Tricuspid valve opens* - The **tricuspid valve opens** during diastole when the right ventricular pressure falls below the right atrial pressure. This event is not directly depicted for the left side of the heart in this Wigger's diagram. - It plays a role in right heart filling and is not related to the events occurring at point Z in the left heart cycle. *Mid systolic click* - A **mid-systolic click** is typically associated with **mitral valve prolapse**, occurring during mid-systole as the mitral leaflets prolapse into the left atrium. - Point Z represents the beginning of ejection, not a valvular abnormality.
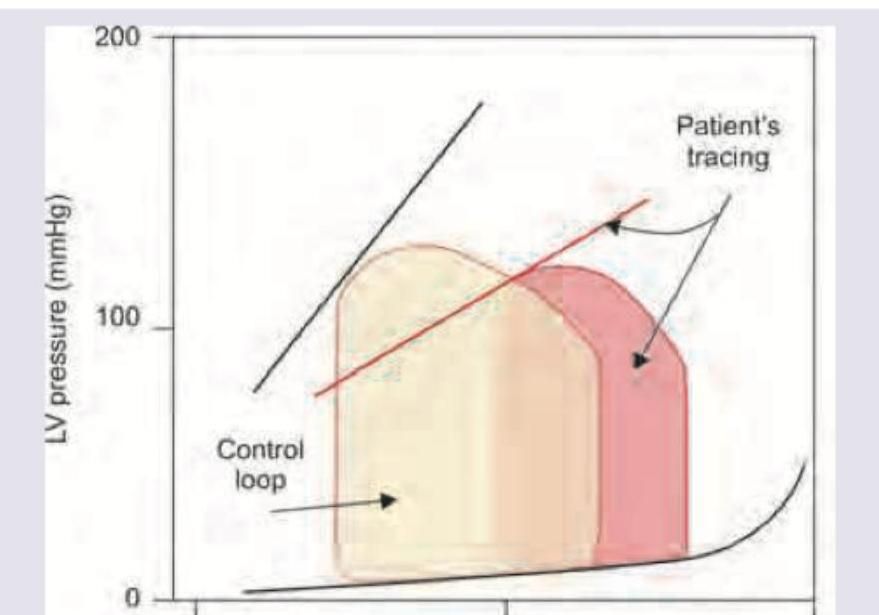
Question 9: The pressure-volume loop of left ventricle tracing of the patient indicates:
- A. Systolic dysfunction
- B. Diastolic dysfunction (Correct Answer)
- C. Decreased atrial compliance
- D. Increased atrial compliance
Explanation: ***Diastolic dysfunction*** - The pressure-volume loop for the patient is shifted to the **left and upward** relative to the control loop, indicating higher left ventricular pressure for a given volume during diastole. - The **end-diastolic pressure-volume relationship (EDPVR)**, shown by the lower right curve, is steeper for the patient, meaning the ventricle is **stiffer or less compliant** during filling. *Systolic dysfunction* - Systolic dysfunction would be characterized by a **reduced stroke volume** (narrower loop horizontally) and a **lower ejection fraction**, often accompanied by a shift to the right due to increased end-diastolic volume. - The **end-systolic pressure-volume relationship (ESPVR)**, which represents contractility, would be shifted downwards and to the right in systolic dysfunction, indicating impaired contractility. *Decreased atrial compliance* - Decreased atrial compliance would primarily affect **atrial pressures** and the force of atrial contraction, which might indirectly impact ventricular filling, but is not directly represented by the ventricular pressure-volume loop's morphology in this manner. - The primary indicator of atrial compliance is often via atrial pressure-volume relationships or specific atrial function studies, not the ventricular loop's overall shift. *Increased atrial compliance* - Increased atrial compliance would allow the atria to accommodate more volume at lower pressures, potentially *improving* ventricular filling if the ventricle itself is compliant, but it would not explain the **elevated ventricular diastolic pressures** seen in the patient's tracing. - This condition would typically lead to lower atrial pressures, which is the opposite of what would contribute to the observed ventricular diastolic dysfunction.
Question 10: Which of the following dissociation curve mentioned is for myoglobin?
- A. Green (Correct Answer)
- B. Purple
- C. Red
- D. None
Explanation: ***Green*** - The **green curve** represents **myoglobin**, which has a much higher affinity for oxygen than hemoglobin. It binds oxygen at very low partial pressures and releases it only when oxygen levels are significantly depleted, as in active muscle tissue. - Myoglobin's dissociation curve is typically **hyperbolic** due to its single oxygen-binding site, reflecting its role in oxygen storage rather than transport. *Purple* - The **purple curve** represents normal **hemoglobin**, which exhibits a **sigmoidal** shape due to its **cooperative binding** of oxygen. This allows hemoglobin to efficiently load oxygen in the lungs and unload it in tissues. - Hemoglobin has a lower oxygen affinity than myoglobin and is designed for oxygen transport, adapting its binding based on oxygen partial pressure. *Red* - The **red curve** likely represents a **right-shifted hemoglobin dissociation curve**, indicating **decreased oxygen affinity**. This shift facilitates oxygen unloading to tissues. - Right shifts occur due to increased temperature, decreased pH (Bohr effect), increased 2,3-DPG, or increased CO₂. These physiological adaptations help deliver more oxygen to metabolically active tissues. *None* - This option is incorrect because the **green curve** clearly represents the characteristic oxygen dissociation curve for myoglobin.