INI-CET 2017 — Physiology
7 Previous Year Questions with Answers & Explanations
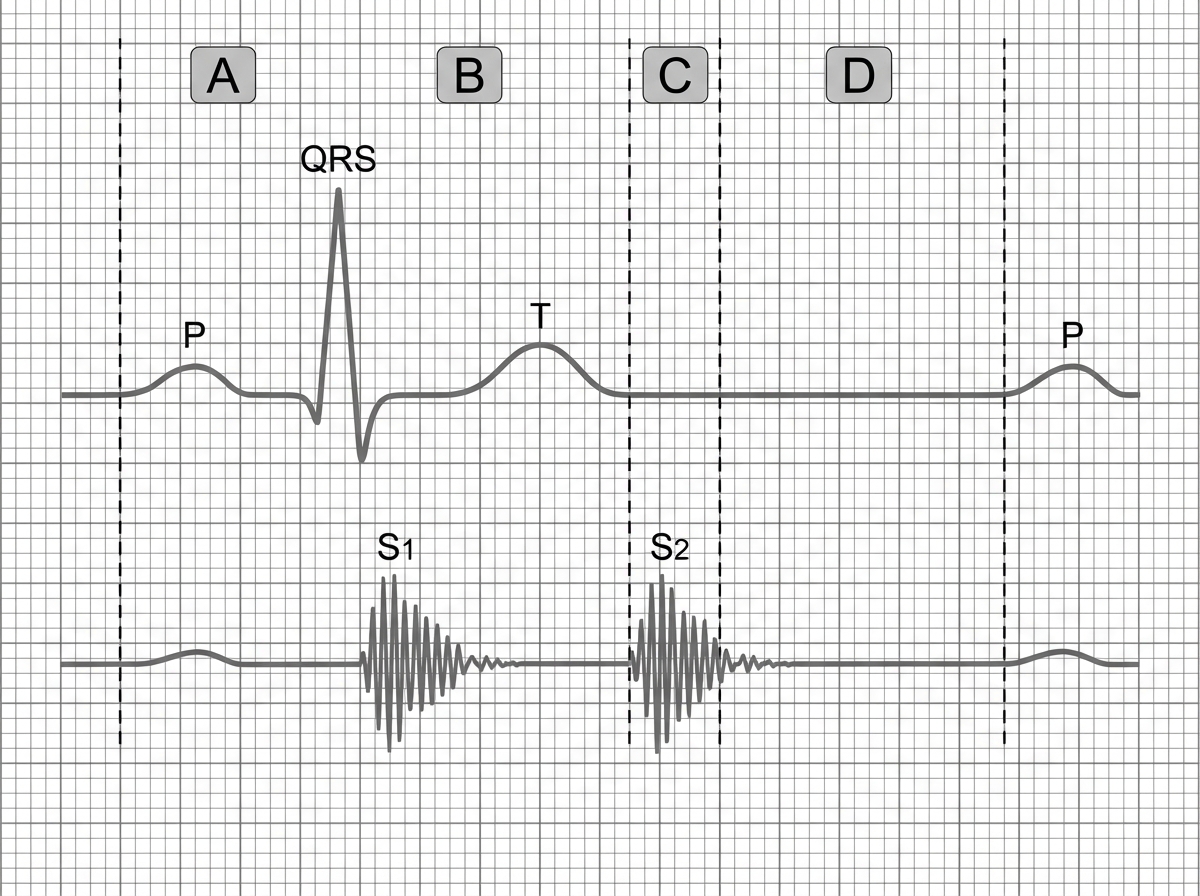
Phonocardiogram tracing is shown below with corresponding ECG. Identify the phase corresponding with $S_{2}$ in phonocardiogram.
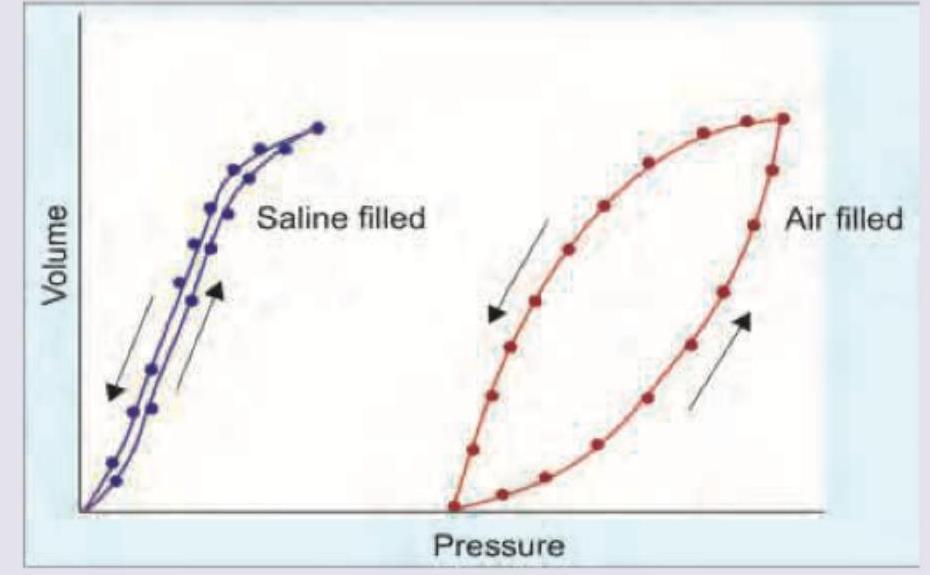
Hysteresis is observed between the deflation and inflation curves in an isolated lung compliance diagram. What is the best description for the same?
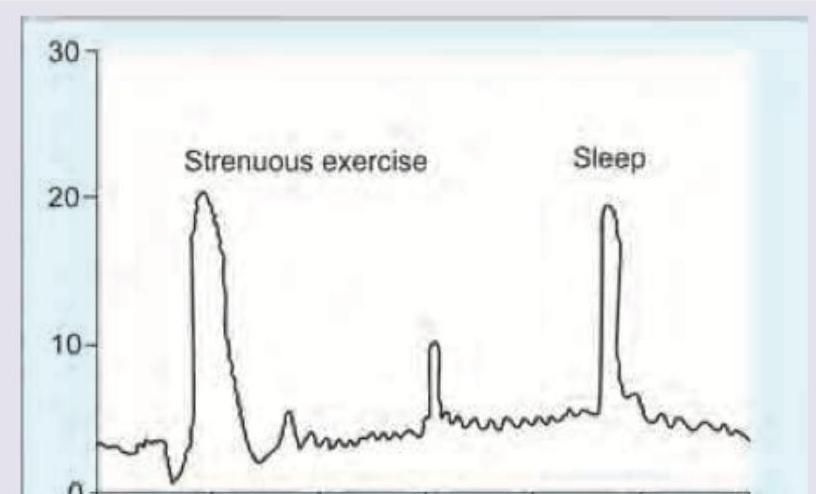
The blood levels of hormones are elevated during exercise and sleep as shown. Which hormone would exhibit this diurnal pattern?
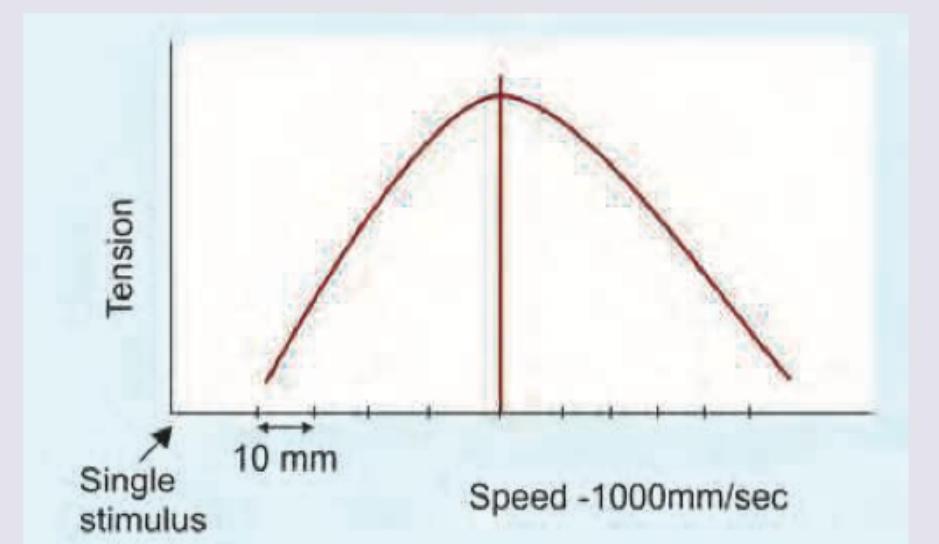
Calculate the tetanizing frequency based on the contraction dynamics of gastrocnemius muscle of frog shown in the image?
There are two blood vessels shown below. Assuming that pressure along both the vessels is same and both of them follow linear flow pattern, what will be the amount of blood flow in A compared to B?
A patient has a blood glucose level of $200 \mathrm{mg} \%$ and GFR of 90. The transport maximum of the patient is as shown in the picture given below. What is the amount of glucose excreted?
Calculate the FEV1/FVC ratio from the spirometry reading shown below.
INI-CET 2017 - Physiology INI-CET Practice Questions and MCQs
Question 1: Phonocardiogram tracing is shown below with corresponding ECG. Identify the phase corresponding with $S_{2}$ in phonocardiogram.
- A. Isovolumetric contraction
- B. Isovolumetric relaxation (Correct Answer)
- C. Rapid ejection
- D. Rapid ventricular filling
Explanation: ***Isovolumetric relaxation*** - **S₂ (second heart sound)** occurs due to closure of the **aortic and pulmonary semilunar valves** at the end of systole, marking the onset of isovolumetric relaxation. - On the **ECG**, S₂ corresponds to the **end of the T wave**, when ventricular pressure drops below aortic pressure causing valve closure. *Isovolumetric contraction* - This phase corresponds to **S₁ (first heart sound)** caused by closure of the **mitral and tricuspid valves** at the beginning of systole. - Occurs on the ECG around the **QRS complex**, not at the timing of S₂. *Rapid ejection* - This phase occurs **between S₁ and S₂** when blood is actively ejected from the ventricles into the aorta and pulmonary artery. - The **semilunar valves are open** during this phase, so no heart sounds are produced. *Rapid ventricular filling* - This phase occurs **after S₂** during early diastole when the **AV valves open** and blood rapidly fills the ventricles. - May be associated with **S₃ gallop** in pathological conditions, but not with S₂.
Question 2: Hysteresis is observed between the deflation and inflation curves in an isolated lung compliance diagram. What is the best description for the same?
- A. Stretching of elastic elements of lung parenchyma
- B. Decrease in surface tension in air-water interface at higher lung volumes
- C. Variation in surface tension forces at air- liquid interface (Correct Answer)
- D. Hering Breuer reflex is operational at higher lung volumes
Explanation: ***Variation in surface tension forces at air-liquid interface*** - The phenomenon of **hysteresis** in lung compliance, particularly the larger loop seen with air-filled lungs compared to saline-filled lungs, is primarily attributable to the **dynamic changes in surface tension** at the air-liquid interface within the alveoli. - During inflation, more energy is required to overcome the opening forces of collapsed alveoli and recruit new ones, leading to a lower volume for a given pressure, while during deflation, previously opened alveoli remain open or close at lower pressures, contributing to the observed difference. *Stretching of elastic elements of lung parenchyma* - While the **elastic elements** of the lung parenchyma contribute to lung compliance, their contribution to hysteresis is relatively minor and would be observed even in saline-filled lungs to a lesser extent. - The difference in hysteresis between air-filled and saline-filled lungs strongly suggests that factors beyond the tissue elasticity are predominantly responsible for the larger hysteresis with air. *Decrease in surface tension in air-water interface at higher lung volumes* - This statement is partially correct regarding surfactant's action. **Surfactant** does reduce surface tension, especially at lower lung volumes, and prevents alveolar collapse. - However, the overall *variation* in surface tension forces throughout the breathing cycle, not just a decrease at higher volumes, is what creates the inspiratory and expiratory limbs of the pressure-volume curve. *Hering Breuer reflex is operational at higher lung volumes* - The **Hering-Breuer reflex** is a protective neurological reflex that terminates inspiration and initiates expiration when the lungs are overinflated. - This reflex is a **neurophysiological control mechanism** for breathing and does not directly explain the physical properties of the lung that contribute to the pressure-volume hysteresis loop.
Question 3: The blood levels of hormones are elevated during exercise and sleep as shown. Which hormone would exhibit this diurnal pattern?
- A. Growth hormone (Correct Answer)
- B. Insulin
- C. Cortisol
- D. Thyroid hormones
Explanation: ***Growth hormone*** - **Growth hormone (GH)** secretion is known to increase significantly during both **strenuous exercise** and **sleep**, particularly during deep sleep stages. - The elevated levels during exercise promote **lipolysis** and **glucose production**, while during sleep, it facilitates **tissue repair** and **growth**. *Insulin* - **Insulin** levels typically **decrease during exercise** to promote the utilization of fat as fuel and increase during sleep in response to reduced metabolic demand and preparation for morning. - Its primary role is to regulate blood glucose, and its secretion is mainly stimulated by **high blood glucose** rather than exercise or sleep directly in this pattern. *Cortisol* - **Cortisol** secretion follows a **circadian rhythm**, peaking in the early morning and gradually decreasing throughout the day, reaching its lowest point at night. - While exercise can acutely increase cortisol, its **sleep-related pattern** is the opposite of what is shown, typically decreasing during early sleep. *Thyroid* - **Thyroid hormones (T3 and T4)** maintain a relatively **stable level** throughout the day and night, with minor diurnal fluctuations. - Their primary function is to regulate **metabolism** and they do not exhibit sharp, distinct peaks in response to exercise or sleep in the manner depicted.
Question 4: Calculate the tetanizing frequency based on the contraction dynamics of gastrocnemius muscle of frog shown in the image?
- A. 10-15 Hz
- B. 15-20 Hz
- C. 20-25 Hz (Correct Answer)
- D. 30-35 Hz
Explanation: **20-25 Hz** - Tetanizing frequency (or fusion frequency) is the stimulation rate at which individual muscle twitches fuse to produce a **smooth, sustained contraction** (tetanus). - For the **frog gastrocnemius muscle**, a common model in physiology, this frequency typically falls within the **20-25 Hz range**. *10-15 Hz* - At this lower frequency, the muscle would likely exhibit **incomplete tetanus** or summation, where individual twitches are still discernible, but tension is increasing. - This range is generally insufficient to achieve a **smooth, fused tetanic contraction** in the frog gastrocnemius. *15-20 Hz* - This range might produce **treppe** or early stages of incomplete tetanus, where successive contractions are slightly stronger, but the relaxation phase is still partially visible between stimuli. - While closer to the tetanizing frequency, it's generally not high enough to achieve **complete fusion** for the frog gastrocnemius. *30-35 Hz* - While this frequency would certainly result in a **fused tetanic contraction**, it's higher than the minimum required for the frog gastrocnemius, which means the muscle is already in complete tetanus at a lower frequency. - Using excessively high frequencies beyond the fusion frequency does not significantly increase tension and can lead to **faster fatigue**.
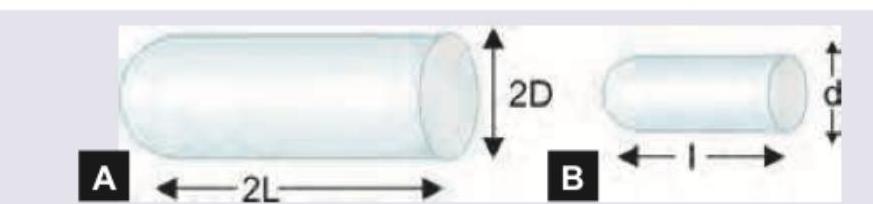
Question 5: There are two blood vessels shown below. Assuming that pressure along both the vessels is same and both of them follow linear flow pattern, what will be the amount of blood flow in A compared to B?
- A. 4 times
- B. 8 times
- C. 16 times
- D. 32 times (Correct Answer)
Explanation: ***32 times*** - According to **Poiseuille's law**: Q = (ΔP × π × r⁴) / (8 × η × L), where flow is proportional to the **fourth power of radius** and inversely proportional to vessel length. - Vessel A has **double the diameter** (radius = 2r) and **half the length** (L/2) compared to vessel B: Q_A ∝ (2r)⁴/(L/2) = 32r⁴/L vs Q_B ∝ r⁴/L, giving ratio of **32**. *4 times* - This would occur with a much smaller radius difference between the vessels than what is shown. - Does not account for the **fourth power relationship** of radius with flow in Poiseuille's equation. *8 times* - This would result if vessel A had **double the diameter** but also **double the length** of vessel B. - Calculation: (2r)⁴/(2L) ÷ (r⁴/L) = 16r⁴/2L ÷ r⁴/L = **8 times**. *16 times* - This would occur if vessel A had **double the radius** but **equal length** to vessel B. - Calculation: (2r)⁴/L ÷ (r⁴/L) = 16r⁴/L ÷ r⁴/L = **16 times**.
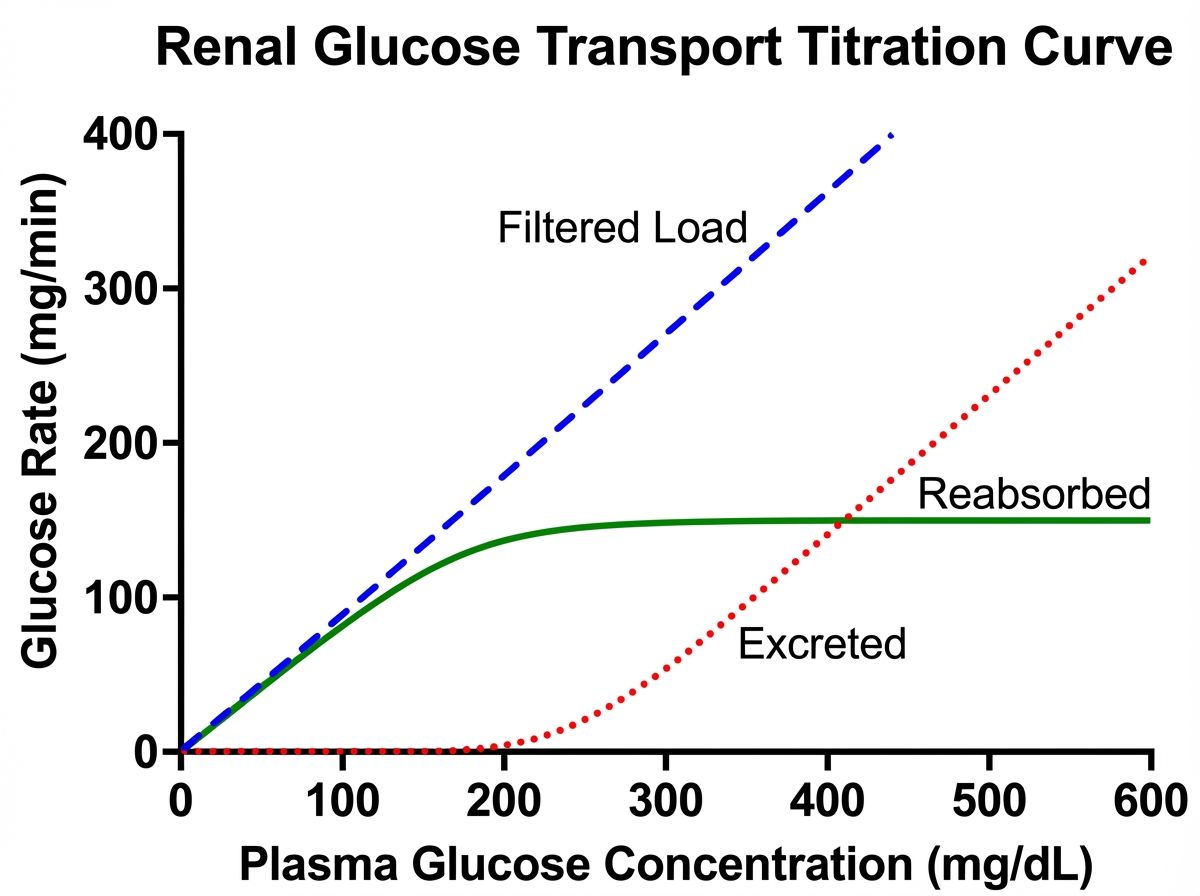
Question 6: A patient has a blood glucose level of $200 \mathrm{mg} \%$ and GFR of 90. The transport maximum of the patient is as shown in the picture given below. What is the amount of glucose excreted?
- A. 30 mg/min (Correct Answer)
- B. 50 mg/min
- C. 90 mg/min
- D. 180 mg/min
Explanation: ***30 mg/min*** - The amount of **glucose filtered** by the kidneys is calculated as GFR × plasma glucose concentration, which is 90 mL/min × 2 mg/mL = **180 mg/min**. - The **transport maximum (Tm)** for glucose is 150 mg/min, meaning the kidneys can reabsorb a maximum of 150 mg/min of glucose per minute. - Since more glucose is filtered (180 mg/min) than can be reabsorbed (150 mg/min), the excess is excreted in urine. - **Glucose excreted** = Filtered - Reabsorbed = 180 mg/min - 150 mg/min = **30 mg/min**. *Incorrect: 50 mg/min* - This would be incorrect as it doesn't match the calculation based on the given values. *Incorrect: 90 mg/min* - This represents the GFR value, not the amount of glucose excreted. *Incorrect: 180 mg/min* - This represents the total amount of glucose filtered, not the amount excreted after reabsorption.
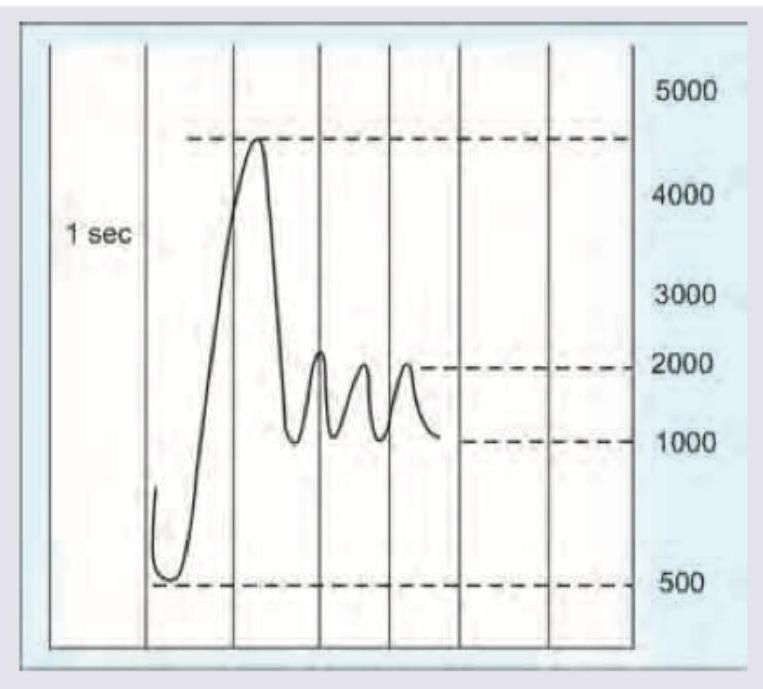
Question 7: Calculate the FEV1/FVC ratio from the spirometry reading shown below.
- A. 60-69 %
- B. 70-79 %
- C. 80-89 % (Correct Answer)
- D. 90-99 %
Explanation: ***80-89 %*** - **Normal FEV1/FVC ratio is >70% in adults, with healthy individuals typically showing 80-90%.** - From the spirometry graph, the total vital capacity (FVC) after full exhalation is approximately **4500 mL**. The volume exhaled in the first second (FEV1) is approximately **4000 mL**. - Therefore, FEV1/FVC = (4000 mL / 4500 mL) × 100% = **88.8%**. This falls within the 80-89% range, indicating **normal lung function**. *60-69 %* - This percentage indicates **severe airflow obstruction**, where the FEV1 is significantly reduced relative to the FVC, which is not supported by the graph's values of **FEV1 ~4000 mL** and **FVC ~4500 mL**. - A ratio of 60-69% is seen in **moderate to severe obstructive lung disease** (COPD, severe asthma). *70-79 %* - This range suggests **mild airflow obstruction**, corresponding to an **FEV1/FVC ratio** that is borderline or slightly reduced (below the normal 80% threshold but above the diagnostic cutoff for obstruction at 70%). - While less severe than 60-69%, it still implies some degree of airway limitation, which is not the case with the calculated ratio of 88.8%. *90-99 %* - This percentage implies an **FEV1/FVC ratio** of 0.9 or higher, meaning that nearly all of the vital capacity is exhaled in the first second. While **88.8%** is close to this range, it does not fall within it. - A ratio this high might be seen in individuals with **excellent lung function** or paradoxically in some cases of **restrictive lung disease** where both FEV1 and FVC are proportionally reduced, but the exact calculated value from the graph is 88.8%, which falls just below 90%.