INI-CET 2015 — Community Medicine
2 Previous Year Questions with Answers & Explanations
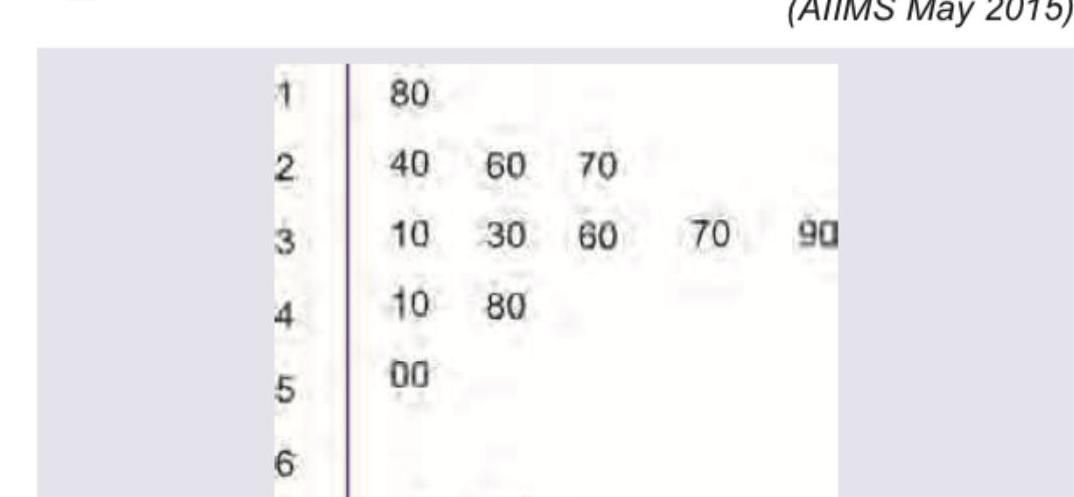
The following statistical diagram is called
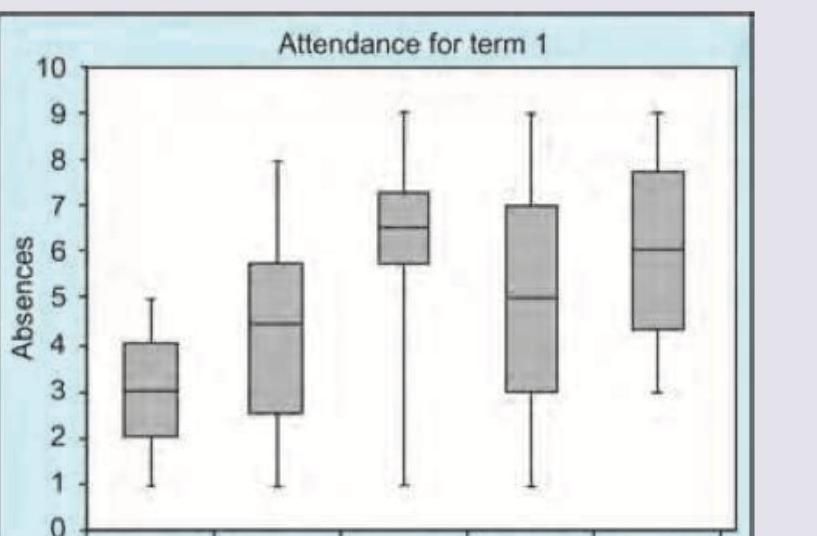
The following statistical diagram is called
INI-CET 2015 - Community Medicine INI-CET Practice Questions and MCQs
Question 1: The following statistical diagram is called
- A. Forest plot
- B. Funnel plot
- C. Box and whisker plot
- D. Stem and leaf plot (Correct Answer)
Explanation: ***Stem and leaf plot*** - This diagram displays quantitative data by separating each value into a "stem" (first digit(s)) and a "leaf" (last digit), arranged in order. - The provided image clearly shows digits on the left serving as stems (e.g., 1, 2, 3) and corresponding digits on the right as leaves (e.g., 80, 40, 60, 70), indicating a stem and leaf plot. *Forest plot* - A forest plot graphically presents the results of a **meta-analysis**, showing the estimated treatment effects and confidence intervals from multiple studies. - It does not organize individual data points by their numerical values in a stem-and-leaf structure. *Funnel plot* - A funnel plot is used to assess **publication bias** in a meta-analysis, plotting the effect size against a measure of study precision (e.g., standard error). - It appears as a scatter plot and does not resemble the structure of the given diagram. *Box and whisker plot* - A box and whisker plot displays the **five-number summary** of a set of data: minimum, first quartile, median, third quartile, and maximum. - It uses a rectangular "box" and "whiskers" extending from it, which is distinctly different from the digit-based organization seen in the image.
Question 2: The following statistical diagram is called
- A. Forest plot
- B. Funnel plot
- C. Box and whisker plot (Correct Answer)
- D. Stem and leaf plot
Explanation: ***Box and whisker plot*** - This diagram displays the **distribution** of a dataset through **quartiles**, with the "box" representing the interquartile range (25th to 75th percentile) and the "whiskers" extending to the minimum and maximum values (or a specified percentile range). - The horizontal line inside each box indicates the **median** of the data, providing a visual summary of central tendency and spread for different categories. *Forest plot* - A forest plot is typically used in **meta-analyses** to display the results of multiple studies measuring the same outcome. - It shows **individual study estimates** and their confidence intervals, along with an overall pooled estimate. *Funnel plot* - A funnel plot is used to assess **publication bias** in meta-analyses. - It plots the effect size against a measure of study precision, and in the absence of bias, the plot should resemble a symmetrical inverted funnel. *Stem and leaf plot* - A stem and leaf plot is a way of organizing numerical data to show its **distribution** while retaining the individual data points. - It separates each data point into a "stem" (the leading digit(s)) and a "leaf" (the trailing digit).