

Relative Risk (RR) - The Cohort Compass
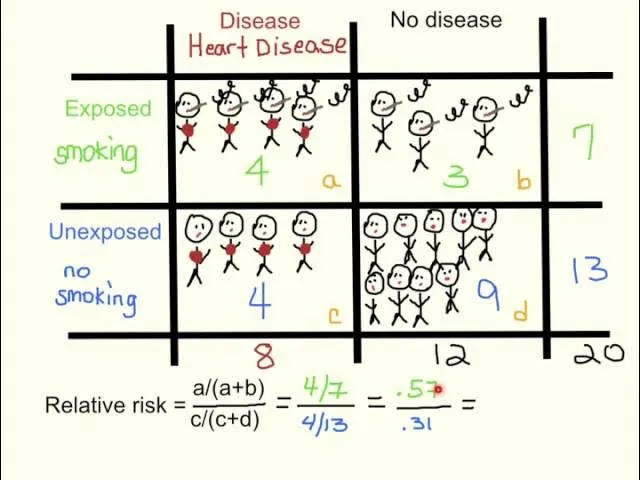
- Definition: Compares the risk of developing a disease in the exposed group to the risk in the unexposed group. The primary measure for cohort studies.
- Calculation: Based on incidence.
- Formula: $RR = \frac{\text{Incidence in exposed}}{\text{Incidence in unexposed}} = \frac{[a/(a+b)]}{[c/(c+d)]}$
- Interpretation:
- $RR > 1$: ↑ risk in the exposed group. (e.g., RR = 2.5 means a 150% increase in risk).
- $RR < 1$: ↓ risk in the exposed group (protective exposure).
- $RR = 1$: No association between exposure and outcome.
📌 Mnemonic: Relative Risk is for cohoRRt studies.
⭐ RR provides a direct measure of risk. A statement like "smokers are 20 times more likely to develop lung cancer" is a statement of relative risk.
Odds Ratio (OR) - The Case-Control Clue
- Primary Use: The go-to measure for case-control studies. We start with the outcome (cases vs. controls) and retrospectively assess for prior exposure.
- Core Question: "What are the odds that a case was exposed versus the odds that a control was exposed?"
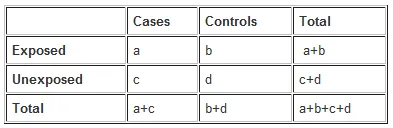
- Calculation: From a 2x2 table, the OR is the ratio of the odds of exposure in cases to the odds of exposure in controls.
- Formula: $OR = (a/c) / (b/d) = ad/bc$
- Interpretation:
- OR > 1: Increased odds of exposure among cases.
- OR < 1: Decreased odds of exposure among cases (protective exposure).
⭐ When disease prevalence is low (<10%), the OR closely approximates the Relative Risk (RR). As prevalence increases, the OR tends to overestimate the RR.
Interpretation - When Odds Aren't Risky
- Odds Ratio (OR) and Relative Risk (RR) measure the association between an exposure and an outcome. Their interpretations differ, especially with common diseases.
| Value | Odds Ratio (OR) Interpretation | Relative Risk (RR) Interpretation |
|---|---|---|
| > 1 | Increased odds of outcome with exposure | Increased risk (probability) of outcome |
| < 1 | Decreased odds of outcome with exposure | Decreased risk (probability) of outcome |
| = 1 | No association between exposure & outcome | No association between exposure & outcome |
-   OR is a good approximation of RR when the disease is rare (prevalence < **10%**).
-   As disease prevalence ↑, the OR increasingly *overestimates* the RR.
-   📌 **OR** **O**verestimates **R**isk.
⭐ Exam Favorite: Case-control studies, which sample based on disease status, can only calculate an Odds Ratio. Prospective cohort studies can calculate both Relative Risk and Odds Ratio.
- Odds Ratio (OR) is the primary measure for case-control studies; it compares the odds of exposure in cases vs. controls.
- Relative Risk (RR) is the standard for cohort studies; it compares the risk of disease in exposed vs. unexposed groups.
- When disease prevalence is low (<10%), the OR approximates the RR.
- With higher prevalence, the OR will overestimate the RR.
- RR is more intuitive: "twice the risk."
- OR is less direct: "twice the odds."
Unlock the full lesson and continue reading
Signup to continue reading this lesson and unlimited access questions, flashcards, AI notes, and more