
Cardiology

On this page
🗺️ Cardiac Architecture: The Hemodynamic Blueprint
The heart's four-chamber design operates as a dual-pump system, with right-sided pressures averaging 25/10 mmHg (systolic/diastolic) and left-sided pressures reaching 120/80 mmHg. Understanding these pressure gradients predicts every valvular lesion, shunt direction, and failure pattern. The cardiac output equation-CO = HR × SV (normal 4-6 L/min)-governs all hemodynamic calculations, where stroke volume depends on preload, afterload, and contractility.

Coronary Vascular Territories
The left anterior descending (LAD) supplies 40-50% of left ventricular mass, including the anterior wall and apex. Occlusion produces the most extensive infarcts with mortality >15% in first 48 hours. The right coronary artery (RCA) dominates in 70% of individuals, supplying the inferior wall and AV node-inferior MIs cause bradycardia in 30-40% of cases.
- Left Main Coronary Artery
- Bifurcates into LAD and circumflex within 1-2 cm
- Critical stenosis (>50%) affects 5% of CAD patients
- Left main disease carries 50% three-year mortality untreated
- LAD Territory
- Anterior wall, septum, apex
- Diagonal branches supply anterolateral segments
- Septal perforators feed bundle branches-occlusion causes RBBB in 5-10%
- Circumflex Territory
- Lateral and posterior walls
- Obtuse marginal branches
- Dominant in 10% (supplies PDA)
- RCA Territory
- Inferior wall, RV, posterior septum
- Acute marginal branches to RV
- Posterior descending artery (PDA) in 70%
📌 Remember: LARD - LAD = Anterior, RCA = Inferior, Circumflex = Lateral. Each vessel's occlusion produces predictable ECG changes: LAD shows V1-V4 changes (80-90% sensitivity), RCA affects II/III/aVF (70-80%), circumflex hits I/aVL/V5-V6 (60-70%).

Valvular Apparatus Engineering
| Valve | Annulus Diameter | Leaflets | Chordae | Papillary Muscles | Normal Gradient |
|---|---|---|---|---|---|
| Mitral | 3.0-4.0 cm | 2 (anterior > posterior) | 25-30 primary/secondary | 2 (anterolateral, posteromedial) | <5 mmHg |
| Aortic | 2.0-2.5 cm | 3 (semilunar cusps) | None | None | <10 mmHg |
| Tricuspid | 4.0-5.0 cm | 3 (anterior, posterior, septal) | Multiple | 3 groups | <3 mmHg |
| Pulmonic | 2.0-2.5 cm | 3 (semilunar cusps) | None | None | <5 mmHg |
⭐ Clinical Pearl: Mitral valve area normally 4-6 cm²; symptoms appear when stenosis reduces area to <2.5 cm² (moderate), with critical stenosis at <1.0 cm² producing resting dyspnea in >90% of patients. Aortic valve area <1.0 cm² (severe stenosis) carries 50% two-year mortality without intervention.
Conduction System Hierarchy
The sinoatrial node fires at 60-100 bpm, located at the junction of superior vena cava and right atrium. AV node delay (0.12-0.20 sec, PR interval) allows atrial systole to contribute 20-30% of ventricular filling-loss of this "atrial kick" in atrial fibrillation reduces cardiac output by 15-25%.
- SA Node Automaticity
- Intrinsic rate 60-100 bpm
- Blood supply from RCA in 60%, circumflex in 40%
- Inferior MI causes sinus bradycardia in 20-30%
- AV Node Properties
- Decremental conduction protects ventricles
- Maximum transmission 180-220 bpm in young adults
- Dual pathway physiology enables AVNRT in 2-3% population
- Fast pathway: shorter refractory period
- Slow pathway: longer refractory, slower conduction
- His-Purkinje System
- Bundle of His travels 1-2 cm through membranous septum
- Right bundle branch: single fascicle, RBBB in 1-2% of normals
- Left bundle: anterior and posterior fascicles
- Anterior fascicle: thin, vulnerable-LAFB common with anterior MI
- Posterior fascicle: broad, dual blood supply-LPFB rare
💡 Master This: Conduction velocity determines QRS morphology: Purkinje fibers conduct at 2-4 m/sec, producing narrow QRS <0.10 sec; ventricular muscle conducts at 0.3-0.5 m/sec, creating wide QRS >0.12 sec in bundle branch blocks. This 6-8 fold speed difference explains why LBBB/RBBB produce QRS ≥0.12 sec.
Connect these anatomical territories through the functional systems explored next to understand how structure enables pathophysiology.
🗺️ Cardiac Architecture: The Hemodynamic Blueprint

📚 Pressure-Volume Dynamics: The Cardiac Cycle Engine
The cardiac cycle integrates electrical activation, mechanical contraction, and hemodynamic flow through seven distinct phases. Systole occupies 1/3 of the cycle at rest (0.3 sec at HR 70), diastole 2/3 (0.5 sec)-tachycardia shortens diastole preferentially, reducing coronary perfusion time and causing ischemia when HR exceeds 150-160 bpm.
Ventricular Systole Mechanics
Isovolumetric contraction begins when ventricular pressure exceeds atrial pressure, closing AV valves (S1 heart sound). Left ventricular pressure rises from 5-10 mmHg to 80 mmHg in 0.05 sec before aortic valve opens. Peak systolic pressure reaches 120 mmHg, generating stroke volume 60-80 mL against systemic vascular resistance 800-1200 dynes·sec·cm⁻⁵.
- Phase 1: Isovolumetric Contraction
- Duration: 0.05 sec
- LV pressure: 10 → 80 mmHg
- All valves closed, volume constant
- Maximal dP/dt: 1200-1800 mmHg/sec (contractility index)
- Phase 2: Rapid Ejection
- Duration: 0.10 sec
- Ejects 70% of stroke volume
- Aortic pressure peaks at 120 mmHg
- Flow velocity: 100-150 cm/sec in ascending aorta
- Phase 3: Reduced Ejection
- Duration: 0.15 sec
- Ejects remaining 30%
- Ventricular pressure falls below aortic
- T-wave on ECG during this phase
📌 Remember: ICRE - Isovolumetric Contraction, Rapid Ejection, Reduced Ejection. Systolic phases account for 0.30 sec total, with ejection fraction calculated as (SV/EDV) × 100% = normal 55-70%. EF <40% defines systolic dysfunction with mortality doubling for each 10% decrease.
Diastolic Filling Sequence
Isovolumetric relaxation occurs when aortic valve closes (S2) until mitral valve opens. LV pressure must fall below left atrial pressure (8-12 mmHg) for filling to begin. Rapid filling contributes 70-80% of ventricular volume in 0.10 sec, driven by the atrioventricular pressure gradient and ventricular suction.
- Phase 4: Isovolumetric Relaxation
- Duration: 0.08 sec
- LV pressure: 80 → 5 mmHg
- Active ATP-dependent process
- Impaired in diastolic dysfunction-tau >40 msec abnormal
- Phase 5: Rapid Filling
- Duration: 0.10 sec
- Fills 70-80% of EDV
- E-wave velocity: 60-80 cm/sec (echo Doppler)
- Creates S3 if rapid/excessive-normal in age <40, pathologic if older
- Phase 6: Diastasis
- Duration: 0.15 sec (shortened with tachycardia)
- Slow continued filling 5%
- Minimal pressure gradient
- Disappears when HR >120 bpm
- Phase 7: Atrial Systole
- Duration: 0.10 sec
- Contributes 20-30% of EDV
- A-wave velocity: 40-60 cm/sec
- Loss in AF reduces CO by 15-25%, more in diastolic dysfunction
⭐ Clinical Pearl: E/A ratio (early/atrial filling velocities) assesses diastolic function: normal 1.0-2.0 in young adults, decreases to 0.5-1.0 with aging. Restrictive pattern shows E/A >2.0 with short deceleration time <150 msec, indicating elevated filling pressures (LVEDP >20 mmHg) and predicting mortality >20% at one year.

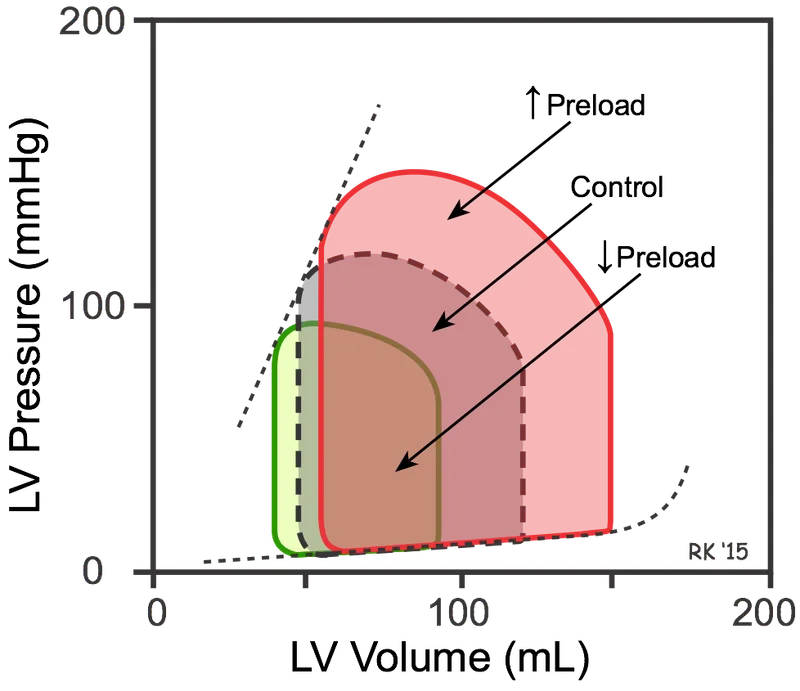
Frank-Starling Mechanism Integration
| Parameter | Normal Range | Decreased Preload | Increased Preload | Increased Afterload | Increased Contractility |
|---|---|---|---|---|---|
| LVEDV | 100-140 mL | ↓ 60-80 mL | ↑ 180-220 mL | → 110-150 mL | ↓ 80-100 mL |
| LVEDP | 8-12 mmHg | ↓ 3-5 mmHg | ↑ 20-30 mmHg | ↑ 15-20 mmHg | → 8-12 mmHg |
| Stroke Volume | 60-80 mL | ↓ 30-40 mL | ↑ 90-110 mL | ↓ 40-50 mL | ↑ 90-120 mL |
| Ejection Fraction | 55-70% | → 55-65% | ↓ 40-50% | ↓ 35-45% | ↑ 70-80% |
| Cardiac Output | 4-6 L/min | ↓ 2-3 L/min | → 5-7 L/min | ↓ 3-4 L/min | ↑ 7-9 L/min |
Sarcomere length determines contractile force: optimal overlap at 2.0-2.2 μm produces maximum tension. Overstretching beyond 2.4 μm reduces actin-myosin interaction, decreasing force-explains why dilated cardiomyopathy (EDV >200 mL) shows reduced contractility despite high preload.
💡 Master This: Afterload equals wall stress during ejection, calculated by LaPlace's Law: Wall Stress = (P × r) / (2 × h), where P = pressure, r = radius, h = wall thickness. Aortic stenosis increases pressure afterload; LV hypertrophy compensates by increasing thickness, normalizing wall stress until severe stenosis (gradient >50 mmHg) overwhelms compensation.
Myocardial Oxygen Supply-Demand Balance
Oxygen extraction in coronary circulation reaches 70-80% at rest (highest of any organ), leaving limited reserve. Increased demand requires proportional flow increase-coronary flow reserve normally 4-5× baseline, reduced to <2× with epicardial stenosis >70%.
- Oxygen Demand Determinants
- Heart rate: 50-60% of total MVO₂
- Wall stress: 20-30% (afterload component)
- Contractility: 10-15%
- Basal metabolism: 5-10%
- Supply Factors
- Coronary perfusion pressure: DBP - LVEDP (80 - 10 = 70 mmHg)
- Diastolic time: 0.5 sec at HR 70, 0.3 sec at HR 120
- Hemoglobin: 13-15 g/dL, each gram carries 1.34 mL O₂
- Coronary resistance: adenosine-mediated autoregulation maintains flow across perfusion pressure 60-140 mmHg
⭐ Clinical Pearl: Subendocardial ischemia develops first because wall stress is highest at endocardium (LaPlace) and perfusion pressure lowest (compressed during systole). ST depression on ECG indicates subendocardial ischemia in 70-80% of cases, while transmural ischemia produces ST elevation with 90-95% specificity for acute occlusion.
Integrate these mechanical principles through the pattern recognition frameworks that follow, revealing how cycle abnormalities manifest clinically.
📚 Pressure-Volume Dynamics: The Cardiac Cycle Engine


🔬 Hemodynamic Fingerprints: Pattern Recognition Mastery
Clinical presentations reflect specific hemodynamic derangements, each producing characteristic pressure tracings, physical findings, and compensatory responses. Master these patterns, and you diagnose structural disease from bedside examination with 70-80% accuracy before imaging.
Pressure Overload Signatures
Left ventricular pressure overload (aortic stenosis, hypertension) produces concentric hypertrophy-wall thickness increases from 9-11 mm to >15 mm while cavity size remains normal. The hypertrophied ventricle generates gradients >50 mmHg in severe AS, maintaining forward flow until decompensation.
- Aortic Stenosis Hemodynamics
- Peak gradient: mild <25 mmHg, moderate 25-50 mmHg, severe >50 mmHg
- Valve area: severe <1.0 cm², critical <0.75 cm²
- LV systolic pressure: 200-250 mmHg with severe stenosis
- Aortic systolic pressure: normal 120 mmHg-creates gradient
- LVEDP: initially normal, rises to 20-30 mmHg with failure
- Preserved EF until late: 55-70% despite symptoms
- Sudden death risk 1%/year once symptomatic
- Syncope indicates critical stenosis-50% two-year mortality
📌 Remember: SAD - Syncope, Angina, Dyspnea mark symptomatic AS with survival: Syncope 3 years, Angina 5 years, Dyspnea 2 years without valve replacement. Each symptom triggers intervention regardless of EF because sudden death risk increases 10-fold.
- Hypertensive Pressure Overload
- Chronic afterload elevation: SVR >1600 dynes·sec·cm⁻⁵
- Concentric remodeling: relative wall thickness >0.42
- Diastolic dysfunction develops first-E/A ratio <0.8
- LV mass index: >115 g/m² men, >95 g/m² women
- Each 50 g/m² increase raises CV event risk 40%
- Regression with treatment reduces events by 25-30%
Volume Overload Patterns
Chronic volume overload (mitral regurgitation, aortic regurgitation) produces eccentric hypertrophy-chamber dilates with proportional wall thickening. LVEDV increases from 100-140 mL to >200 mL, maintaining EF >50% through Starling mechanism until myocardial dysfunction supervenes.
- Mitral Regurgitation Physiology
- Regurgitant volume: mild <30 mL, moderate 30-60 mL, severe >60 mL
- Regurgitant fraction: severe >50% of total stroke volume
- LA pressure: giant V-wave >40 mmHg with acute MR
- LV volume: 200-300 mL in chronic severe MR
- Forward stroke volume maintained until late
- EF >60% compensates for regurgitation
- EF <60% indicates myocardial dysfunction-surgery urgent
- LVESD >45 mm predicts poor postoperative outcome
- Aortic Regurgitation Adaptations
- Diastolic pressure falls: severe AR shows DBP 40-50 mmHg
- Pulse pressure widens: >80 mmHg with severe AR
- LVEDV: >250 mL in chronic severe AR
- LVESD: surgery indicated when >50 mm or EF <50%
- Compensated phase lasts 10-15 years
- Decompensation rapid once EF falls-50% mortality at 2 years
⭐ Clinical Pearl: Acute vs chronic regurgitation produces opposite LA/LV responses. Acute MR: normal-sized LA cannot accommodate regurgitant volume, pressure rises to 40-60 mmHg, causing flash pulmonary edema in 80-90%. Chronic MR: LA dilates to >60 mL/m², pressure stays 15-20 mmHg, symptoms develop gradually over years.
Restrictive Filling Physiology
Restrictive cardiomyopathy and constrictive pericarditis both impair diastolic filling, producing "square root sign" on ventricular pressure tracings-rapid early dip followed by plateau. Differentiation requires integrating hemodynamics with imaging.
| Feature | Restrictive CMP | Constrictive Pericarditis | Sensitivity/Specificity |
|---|---|---|---|
| Ventricular interdependence | Minimal | Marked (discordant septum) | 90%/85% |
| Respiratory variation | LVEDP varies <5 mmHg | LVEDP varies >10 mmHg | 85%/90% |
| RV systolic pressure | Often >50 mmHg | Usually <50 mmHg | 70%/75% |
| BNP level | Elevated >400 pg/mL | Normal <100 pg/mL | 85%/80% |
| Tissue Doppler e' | Reduced <8 cm/sec | Normal >8 cm/sec | 80%/85% |
| Pericardial thickness | Normal <2 mm | Increased >4 mm | 60%/95% |
💡 Master This: Ventricular interdependence distinguishes constriction from restriction. During inspiration, increased venous return fills RV, shifting septum leftward and reducing LV filling-LV systolic pressure drops >10 mmHg (pulsus paradoxus) in 60-80% of constriction. Restriction shows minimal interdependence because myocardial stiffness, not pericardial constraint, limits filling.
Shunt Hemodynamics
Left-to-right shunts increase pulmonary blood flow (Qp), creating Qp:Qs ratios >1.5:1 that warrant closure. Right-to-left shunts bypass lungs, causing cyanosis when Qp:Qs <0.7:1 or shunt fraction >30%.
- Atrial Septal Defect Flow
- Qp:Qs typically 2:1 to 3:1
- RA pressure: 8-12 mmHg (elevated)
- RV volume overload: RVEDV >200 mL
- PA pressure: normal until 4th-5th decade
- Eisenmenger develops in 10-15% if unclosed
- Ventricular Septal Defect Dynamics
- Qp:Qs: 1.5:1 small, >3:1 large
- LV pressure transmitted to RV in large VSDs
- PA pressure: elevated early->50 mmHg by age 1-2
- PVR: irreversible changes if >8 Wood units
- Surgery contraindicated when PVR >8 Wood units
- Eisenmenger develops in 50% of large unrepaired VSDs
⭐ Clinical Pearl: Oxygen step-up localizes shunt level. Normal oxygen saturation increases <5% between chambers. Step-up ≥7% indicates shunt: RA step-up (ASD), RV step-up (VSD), PA step-up (PDA). Magnitude predicts Qp:Qs: 10% step-up ≈ Qp:Qs 2:1, 15% step-up ≈ 3:1.
Synthesize these hemodynamic patterns through the differential frameworks that follow, distinguishing similar presentations using quantitative discriminators.
🔬 Hemodynamic Fingerprints: Pattern Recognition Mastery


🏥 Clinical Syndrome Discrimination: The Differential Matrix
Chest pain, dyspnea, and syncope represent common presentations with diverse etiologies. Systematic discrimination using quantitative clinical features, biomarkers, and imaging characteristics achieves >85% diagnostic accuracy before invasive testing.
Acute Chest Pain Differentiation
Life-threatening causes-ACS, aortic dissection, pulmonary embolism, tension pneumothorax-require immediate recognition. Each produces characteristic pain quality, timing, radiation, and associated features with distinct prevalence patterns.
| Feature | ACS | Aortic Dissection | Pulmonary Embolism | Pericarditis | Musculoskeletal |
|---|---|---|---|---|---|
| Pain quality | Pressure, squeezing | Tearing, ripping | Sharp, pleuritic | Sharp, pleuritic | Aching, reproducible |
| Onset | Gradual 5-10 min | Sudden <1 min | Sudden <5 min | Gradual hours-days | Variable |
| Radiation | Jaw, arm, back | Back, abdomen | None typically | None | Localized |
| Duration | >10 min, variable | Persistent hours | Persistent | Persistent days | Intermittent |
| Position change | No effect | No effect | Worse supine | Better leaning forward | Variable effect |
| Troponin elevation | >99th percentile in >95% | Normal 80% | Elevated 30-50% | Mild elevation 35% | Normal >95% |
| ECG changes | ST/T changes >70% | Normal 60%, LVH pattern | S1Q3T3 20%, TWI V1-V4 | Diffuse ST elevation 60% | Normal >90% |
| D-dimer | Variable | Elevated >90% if IMH | Elevated >95% | Normal >80% | Normal >95% |
📌 Remember: RIPPED - Ripping (dissection), Infarction (ACS), Pleuritic (PE/pericarditis), Positional (pericarditis), Exertional (angina), Duration >10 min (ischemia). Pain character narrows differential: tearing suggests dissection (sensitivity 50%, specificity 95%), pressure suggests ischemia (sensitivity 70%, specificity 60%).

Dyspnea Pattern Analysis
Dyspnea timing, positional variation, and associated symptoms distinguish cardiac from pulmonary from mixed etiologies. Orthopnea (sensitivity 80% for HF) and paroxysmal nocturnal dyspnea (specificity 90%) indicate elevated filling pressures >18 mmHg.
- Heart Failure Dyspnea
- Orthopnea: develops within 5-10 min of lying flat
- PND: awakens patient after 2-4 hours sleep
- Exertional: progressive with NYHA class
- Class II: dyspnea with moderate exertion (walking >1 block)
- Class III: dyspnea with minimal exertion (walking <1 block)
- Class IV: dyspnea at rest
- BNP: >400 pg/mL has 90% sensitivity, >900 pg/mL indicates severe HF
- Lung exam: bibasilar crackles in 60-70%, absent in chronic HF with compensation
- Pulmonary Dyspnea
- COPD: prolonged expiratory phase, wheezing, barrel chest
- Asthma: episodic, nocturnal (but 2-6 AM, not 2-4 hours after sleep)
- ILD: dry cough, Velcro crackles, clubbing in 50%
- BNP: typically <100 pg/mL unless cor pulmonale
- SpO₂: responds to supplemental O₂ in >90%
- Mixed/Other Causes
- Anemia: gradual onset, pallor, Hgb <8 g/dL symptomatic
- Deconditioning: rapid recovery post-exertion <2 min
- Anxiety: sighing respirations, paresthesias, normal exam
⭐ Clinical Pearl: BNP interpretation requires age adjustment: cutoff 100 pg/mL for age <50, 200 pg/mL for age 50-75, 300 pg/mL for age >75. Obesity lowers BNP-50% reduction with BMI >35. Renal failure elevates BNP independent of volume status-30-50% higher with GFR <30 mL/min.
Syncope Mechanism Stratification
Syncope results from global cerebral hypoperfusion <30 mmHg for >6-8 seconds. Cardiac causes (arrhythmia, obstruction) carry 20-30% one-year mortality; reflex/orthostatic causes show <5% mortality.
- Cardiac Syncope Features
- No prodrome in 70-80% (sudden onset)
- Occurs during exertion or supine
- Associated palpitations in 40-50%
- Structural heart disease present in >80%
- ECG abnormalities in >90%
- QRS >120 msec: LBBB/RBBB suggests VT
- QTc >500 msec: torsades risk 5-10%/year
- Epsilon wave: ARVC, VT risk 10-15%/year
- Brugada pattern: VF risk 1-2%/year
- Reflex Syncope Characteristics
- Prodrome >5 seconds in >80% (nausea, diaphoresis, tunnel vision)
- Situational triggers: micturition, defecation, cough
- Prolonged standing in 60%
- Rapid recovery <60 seconds
- Normal cardiac exam and ECG in >95%
- Orthostatic Syncope Pattern
- Symptoms within 3 minutes of standing
- BP drop: ≥20 mmHg systolic or ≥10 mmHg diastolic
- Medications: diuretics, alpha-blockers, vasodilators
- Autonomic neuropathy: diabetes 30%, Parkinson's 50%
💡 Master This: San Francisco Syncope Rule identifies high-risk patients requiring admission: CHF history, Hematocrit <30%, ECG abnormal, Shortness of breath, SBP <90 mmHg. Any one criterion present indicates 5-10% serious event risk at 7 days; all absent has 99% negative predictive value.
Advance these discrimination skills through the evidence-based treatment algorithms that integrate mechanism understanding with therapeutic outcomes.
🏥 Clinical Syndrome Discrimination: The Differential Matrix


🔍 Therapeutic Algorithms: Evidence-Based Intervention Mastery
Treatment selection integrates disease severity, comorbidities, and evidence-based outcomes. Guideline-directed medical therapy (GDMT) reduces mortality 25-40% in heart failure, 30-50% in post-MI patients, and 20-30% in high-risk primary prevention.
Heart Failure Treatment Cascade
Neurohormonal blockade forms the foundation: ACE inhibitors/ARBs, beta-blockers, mineralocorticoid receptor antagonists (MRAs), and SGLT2 inhibitors each independently reduce mortality 15-30%. Sequential addition follows functional class progression.
- Stage A (At Risk): Preventive Strategies
- Hypertension control: target <130/80 mmHg reduces HF risk 50%
- Statin therapy: LDL <70 mg/dL in CAD reduces events 25-30%
- Diabetes management: HbA1c <7% reduces microvascular complications 40%
- SGLT2 inhibitors: reduce HF hospitalization 30% in diabetics
- Stage B (Structural Disease, No Symptoms): GDMT Initiation
- ACE inhibitor: start low, uptitrate to target-enalapril 10 mg BID reduces progression 30%
- Beta-blocker: carvedilol 25 mg BID or metoprolol succinate 200 mg daily reduces mortality 35%
- Statin: regardless of LDL if CAD present
- ICD: if EF <30% post-MI (>40 days), reduces sudden death 50-60%
- Stage C (Symptomatic HF): Triple/Quadruple Therapy
- ACE/ARB or ARNI: sacubitril-valsartan 97/103 mg BID reduces mortality 20% vs enalapril
- Beta-blocker: uptitrate to HR 50-60 bpm
- MRA: spironolactone 25-50 mg daily reduces mortality 30% if EF <35%
- SGLT2 inhibitor: dapagliflozin 10 mg daily reduces HF hospitalization 30%, mortality 18%
- Diuretics: furosemide 20-240 mg daily for congestion (no mortality benefit)
- Loop diuretics: threshold effect requires minimum 40 mg furosemide equivalent
- Resistance: double dose or add thiazide for synergy
- Target: euvolemia without hypotension (SBP >90 mmHg)
📌 Remember: ABCD - ACE/ARB/ARNI, Beta-blocker, Corticosteroid (MRA), Diabetes drug (SGLT2i). Each pillar reduces mortality independently; combined therapy provides 50-60% relative risk reduction vs placebo. Initiate all four in Stage C regardless of sequence, uptitrating every 2-4 weeks as tolerated.

| Drug Class | Initial Dose | Target Dose | Mortality Reduction | Key Monitoring | Contraindications |
|---|---|---|---|---|---|
| ACE inhibitor (enalapril) | 2.5 mg BID | 10-20 mg BID | ↓ 20-25% | Cr, K+ at 1-2 weeks | Cr >3.0, K+ >5.5, bilateral RAS |
| ARB (losartan) | 25 mg daily | 50-100 mg daily | ↓ 15-20% | Cr, K+ at 1-2 weeks | Same as ACE |
| ARNI (sacubitril-valsartan) | 49/51 mg BID | 97/103 mg BID | ↓ 20% vs ACE | BP, Cr, K+, angioedema | ACE within 36 hours |
| Beta-blocker (carvedilol) | 3.125 mg BID | 25-50 mg BID | ↓ 35% | HR, BP, HF symptoms | HR <50, SBP <90, decompensation |
| MRA (spironolactone) | 12.5-25 mg daily | 25-50 mg daily | ↓ 30% | K+, Cr weekly initially | K+ >5.0, Cr >2.5 |
| SGLT2i (dapagliflozin) | 10 mg daily | 10 mg daily | ↓ 18% | Volume status, GFR | eGFR <25, T1DM |
⭐ Clinical Pearl: ARNI provides greatest benefit in recently hospitalized patients-number needed to treat (NNT) 25 to prevent one death over 2 years vs enalapril. Requires 36-hour washout from ACE inhibitor to avoid angioedema (risk 0.5% with ARNI alone, 1-2% if inadequate washout). Contraindicated in pregnancy-switch to hydralazine-nitrate combination.
Acute Coronary Syndrome Management Timeline
Time-dependent interventions define ACS outcomes: door-to-balloon <90 minutes reduces mortality from 7% to 3% in STEMI. Antiplatelet and anticoagulation therapy initiated immediately reduces recurrent events 30-50%.
- Immediate Interventions (0-10 Minutes)
- Aspirin 162-325 mg chewed: reduces mortality 23%
- Oxygen if SpO₂ <90%: no benefit if saturation normal
- Nitroglycerin SL 0.4 mg × 3: avoid if RV infarct (inferior STEMI), SBP <90 mmHg
- Morphine **2
Unlock the full lesson and continue reading
Signup to continue reading this lesson and unlimited access questions, flashcards, AI notes, and more


Have doubts about this lesson?
Ask Rezzy, your AI Study Mate, to explain anything you didn't understand
Everything you need for NEET-PG prep
Get full Oncourse access with lessons, practice questions, flashcards and AI study tools.
Scan to download app