
Bone and Soft Tissue Pathology

On this page
🔬 Pathological Precision: The Bone and Soft Tissue Detective System
Bone and soft tissue pathology demands a detective's eye and an architect's precision-you'll learn to decode the cellular blueprints of mesenchymal tumors, distinguish benign mimics from aggressive sarcomas, and master the pattern recognition that separates osteosarcoma from chondrosarcoma at a glance. This lesson builds your diagnostic radar through systematic evaluation of histologic features, imaging correlations, and molecular markers, then connects these insights to treatment algorithms that directly impact surgical planning and patient outcomes. By integrating pathophysiology with clinical decision-making, you'll transform complex tissue specimens into actionable diagnoses that guide oncologic care.
The diagnostic complexity stems from the remarkable diversity of mesenchymal tissues-bone, cartilage, muscle, fat, fibrous tissue, and vascular structures-each capable of generating unique pathological entities. Primary bone tumors occur at an incidence of 0.9 per 100,000 population annually, while soft tissue sarcomas represent 1% of all adult malignancies and 15% of pediatric cancers.
📌 Remember: BONES for primary bone tumor age distribution - Benign (10-30 years), Osteosarcoma (10-25 years), Neuroblastoma metastases (0-5 years), Ewing sarcoma (5-25 years), Secondary/metastatic (>40 years)
Modern pathological diagnosis integrates traditional histomorphology with advanced molecular techniques. Immunohistochemistry panels can distinguish between 95% of soft tissue tumors, while cytogenetic analysis reveals specific chromosomal translocations in 85% of sarcomas. Next-generation sequencing now identifies actionable mutations in 60% of bone and soft tissue malignancies.
⭐ Clinical Pearl: The "rule of 2s" in pediatric bone pathology-2% of all childhood cancers are primary bone tumors, with peak incidence at age 15-19 years during periods of maximum bone growth velocity (2-4 cm/year)
| Tissue Type | Benign:Malignant Ratio | Peak Age (Benign) | Peak Age (Malignant) | 5-Year Survival (Malignant) | Most Common Location |
|---|---|---|---|---|---|
| Bone | 10:1 | 10-30 years | 15-25 years | 65-70% | Metaphysis of long bones |
| Soft Tissue | 100:1 | 20-40 years | 50-70 years | 50-60% | Extremities (60%) |
| Cartilage | 5:1 | 20-50 years | 40-60 years | 75-85% | Pelvis, ribs, long bones |
| Muscle | 50:1 | Any age | 40-60 years | 45-55% | Thigh, retroperitoneum |
| Vascular | 20:1 | Childhood | 60-80 years | 30-40% | Head/neck, extremities |
💡 Master This: Tumor grade predicts behavior more accurately than histological subtype-a high-grade fibrosarcoma has similar metastatic potential (40-60%) to high-grade osteosarcoma, despite different tissue origins
Understanding bone and soft tissue pathology transforms diagnostic uncertainty into systematic pattern recognition, enabling precise classification that drives targeted therapeutic approaches and accurate prognostic assessment.
🔬 Pathological Precision: The Bone and Soft Tissue Detective System


⚙️ Cellular Architecture: The Mesenchymal Machinery Blueprint
Mesenchymal stem cells differentiate along multiple lineage pathways with >95% fidelity under normal conditions. Osteoblast differentiation requires sequential activation of transcription factors including Runx2, Osterix, and ATF4, producing type I collagen at rates of 1-2 μg per cell per day. Chondroblast maturation follows Sox9-dependent pathways, synthesizing type II collagen and aggrecan to create cartilage matrix with compressive strength of 5-25 MPa.
Bone matrix architecture consists of 65% inorganic hydroxyapatite and 35% organic matrix (primarily type I collagen). Osteoid mineralization occurs through controlled calcium phosphate deposition at nucleation sites within collagen fibrils, achieving compressive strength of 170 MPa-comparable to concrete. Trabecular bone demonstrates porosity of 75-95% while maintaining structural integrity through optimal geometric arrangement.
📌 Remember: MATRIX for bone composition - Minerals (65% hydroxyapatite), Alkaline phosphatase (mineralization enzyme), Type I collagen (90% of organic matrix), Remodeling (10% annually), Inorganic phosphate, X-linking (pyridinium cross-links)
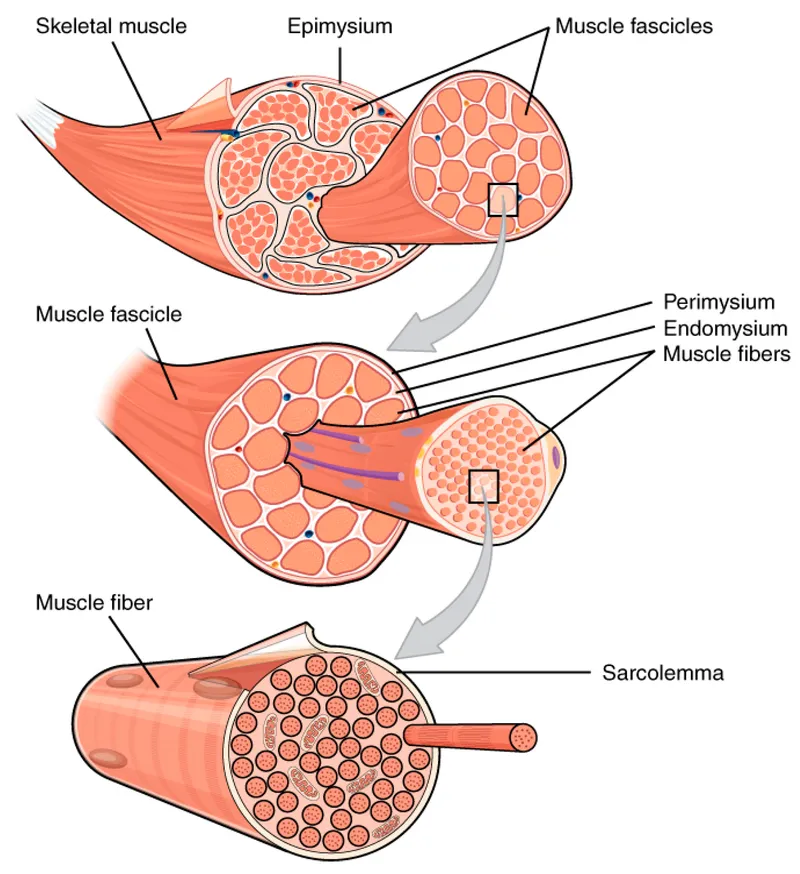
Soft tissue architecture varies dramatically across tissue types. Skeletal muscle contains multinucleated myofibers with sarcomere lengths of 2.5 μm, generating contractile forces of 30-40 N/cm². Adipose tissue consists of unilocular adipocytes storing triglycerides at energy density of 37 kJ/g. Fibrous connective tissue produces type I collagen with tensile strength of 50-100 MPa.
| Tissue Component | Primary Matrix | Cellular Density | Turnover Rate | Mechanical Properties | Key Markers |
|---|---|---|---|---|---|
| Cortical Bone | Type I collagen + hydroxyapatite | 20,000 cells/mm³ | 2-5% annually | 170 MPa compressive | Osteocalcin, ALP |
| Trabecular Bone | Type I collagen + hydroxyapatite | 50,000 cells/mm³ | 25% annually | 15 MPa compressive | TRAP, Runx2 |
| Hyaline Cartilage | Type II collagen + aggrecan | 15,000 cells/mm³ | <1% annually | 25 MPa compressive | Sox9, Col2A1 |
| Skeletal Muscle | Actin + myosin filaments | 300 nuclei/mm | 1-2% daily | 40 N/cm² contractile | MyoD, Desmin |
| Dense Fibrous | Type I collagen bundles | 5,000 cells/mm³ | 5% annually | 100 MPa tensile | Vimentin, Col1A1 |
⭐ Clinical Pearl: Architectural preservation distinguishes benign from malignant lesions with 90% accuracy-benign bone tumors maintain trabecular patterns and zonal organization, while sarcomas show chaotic cellular arrangement and loss of tissue boundaries
Matrix production abnormalities characterize specific pathological entities. Osteosarcoma produces malignant osteoid with irregular mineralization patterns and abnormal collagen cross-linking. Chondrosarcoma synthesizes abnormal cartilage matrix with altered proteoglycan composition and disrupted collagen architecture. Fibrosarcoma demonstrates disorganized collagen deposition with loss of normal fascicular patterns.
💡 Master This: Matrix quality reflects cellular function-normal osteoblasts produce organized osteoid with predictable mineralization kinetics (10-20 days), while malignant cells create disorganized matrix with aberrant mineral deposition and compromised mechanical properties
Understanding mesenchymal architecture provides the foundation for recognizing pathological deviations and predicting tumor behavior based on cellular organization patterns.
⚙️ Cellular Architecture: The Mesenchymal Machinery Blueprint


🎯 Pattern Recognition: The Diagnostic Radar System
Age-location correlation provides the first diagnostic filter. Osteosarcoma demonstrates bimodal age distribution-75% occur in patients 10-25 years during peak bone growth, with secondary peak after age 60 in Paget's disease or post-radiation. Ewing sarcoma shows 90% incidence before age 30 with diaphyseal predilection in long bones and flat bone involvement in 25% of cases.
Location-specific patterns narrow differential diagnosis significantly:
- Metaphyseal lesions (ages 10-25): Osteosarcoma (40%), Giant cell tumor (25%), Chondroblastoma (15%)
- Diaphyseal lesions (ages 5-25): Ewing sarcoma (60%), Osteoid osteoma (20%), Fibrous dysplasia (15%)
- Epiphyseal lesions (any age): Chondroblastoma (50%), Giant cell tumor (30%), Clear cell chondrosarcoma (10%)
- Axial skeleton (ages 40-70): Chondrosarcoma (35%), Metastases (30%), Multiple myeloma (20%)
📌 Remember: AGES for bone tumor location patterns - Axial skeleton (chondrosarcoma, myeloma), Growing metaphysis (osteosarcoma), Epiphysis (chondroblastoma, GCT), Shaft/diaphysis (Ewing sarcoma)
Radiological pattern recognition follows systematic evaluation criteria. Permeative destruction with moth-eaten appearance suggests aggressive malignancy with >90% correlation to high-grade sarcomas. Geographic destruction with sclerotic margins indicates benign or low-grade lesions in 85% of cases. Codman triangle and sunburst patterns characterize osteosarcoma with 70% specificity.
Histological pattern recognition requires systematic morphological assessment:
| Pattern Category | Benign Features | Malignant Features | Diagnostic Accuracy | Key Discriminators |
|---|---|---|---|---|
| Cellular Density | <50% cellularity | >75% cellularity | 85% | Nuclear:cytoplasm ratio |
| Nuclear Features | Uniform, small | Pleomorphic, large | 90% | Chromatin pattern |
| Mitotic Activity | <2 per 10 HPF | >10 per 10 HPF | 95% | Atypical mitoses |
| Architecture | Organized, zonal | Chaotic, infiltrative | 88% | Growth pattern |
| Matrix Quality | Mature, organized | Immature, disorganized | 80% | Mineralization pattern |
⭐ Clinical Pearl: "Rule of 5s" in soft tissue sarcoma grading-lesions >5 cm, >5 mitoses per 10 HPF, and >5% necrosis have >50% probability of high-grade behavior and metastatic potential
Molecular pattern recognition increasingly guides diagnosis. Ewing sarcoma demonstrates t(11;22)(q24;q12) translocation in 85% of cases, creating EWS-FLI1 fusion protein. Synovial sarcoma shows t(X;18)(p11;q11) in >95% of cases, producing SYT-SSX fusion. Dermatofibrosarcoma protuberans exhibits t(17;22)(q22;q13) creating COL1A1-PDGFB fusion in 90% of cases.

💡 Master This: Pattern integration requires correlation of age, location, imaging, histology, and molecular data-no single feature provides definitive diagnosis, but systematic pattern analysis achieves >95% diagnostic accuracy in experienced hands
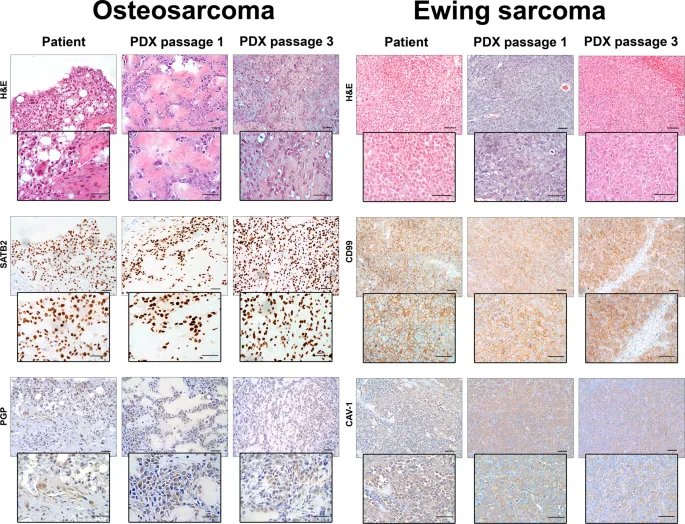
Immunohistochemical patterns provide additional diagnostic precision. Osteosarcoma shows positive osteocalcin (80%), alkaline phosphatase (70%), and Runx2 (90%). Rhabdomyosarcoma demonstrates MyoD (95%), myogenin (90%), and desmin (85%) positivity. Gastrointestinal stromal tumors exhibit CD117 (95%) and DOG1 (90%) expression.
Systematic pattern recognition transforms complex pathological data into actionable diagnostic frameworks, enabling precise tumor classification and appropriate therapeutic planning.
🎯 Pattern Recognition: The Diagnostic Radar System


🔍 Differential Mastery: The Pathological Discrimination Engine
Age-based differential frameworks provide systematic discrimination strategies. Pediatric bone lesions (ages 0-18) require differentiation between osteosarcoma, Ewing sarcoma, and benign entities. Osteosarcoma shows metaphyseal location (90%), osteoid production, and alkaline phosphatase elevation (80%). Ewing sarcoma demonstrates diaphyseal involvement (70%), small round blue cells, and CD99 positivity (95%).
Adult bone lesions (ages >40) predominantly represent metastatic disease (85%) versus primary bone tumors (15%). Metastatic carcinoma shows multiple lesions (70%), known primary tumor (60%), and cytokeratin positivity. Multiple myeloma demonstrates punched-out lesions, monoclonal protein (90%), and CD138 positivity.
Soft tissue mass discrimination follows size-based risk stratification. Masses <5 cm have <10% malignancy risk, while masses >5 cm carry >50% sarcoma probability. Deep location increases malignancy risk 5-fold compared to superficial lesions. Rapid growth (doubling time <6 months) suggests high-grade malignancy in 80% of cases.
| Discriminating Feature | Benign Indicators | Malignant Indicators | Sensitivity | Specificity | Clinical Impact |
|---|---|---|---|---|---|
| Size | <5 cm (90% benign) | >5 cm (50% malignant) | 85% | 70% | Biopsy threshold |
| Location | Superficial (95% benign) | Deep (60% malignant) | 80% | 85% | Imaging protocol |
| Growth Rate | Stable >2 years | Doubling <6 months | 90% | 75% | Urgency assessment |
| Pain Pattern | Mechanical, predictable | Constant, night pain | 70% | 80% | Symptom evaluation |
| Age Distribution | <30 years variable | >50 years high risk | 75% | 65% | Risk stratification |
Osteoid versus chondroid matrix discrimination determines tumor lineage. Osteoid appears as eosinophilic, homogeneous material with direct bone formation and alkaline phosphatase positivity. Chondroid matrix shows basophilic, lobular architecture with S-100 positivity and type II collagen expression.
Molecular discrimination provides definitive diagnostic precision. Translocation-associated sarcomas demonstrate specific fusion genes with >95% diagnostic accuracy. Ewing sarcoma family shows EWS rearrangements in 95% of cases-EWS-FLI1 (85%), EWS-ERG (10%), or rare variants (5%). Synovial sarcoma exhibits SYT-SSX fusions in >98% of cases.
Immunohistochemical discrimination panels follow systematic algorithms:
- Round cell tumors: CD99, FLI1, MyoD, myogenin, CD45, cytokeratin
- Spindle cell tumors: SMA, desmin, S-100, CD34, cytokeratin, melanoma markers
- Epithelioid tumors: Cytokeratin, EMA, melanoma markers, CD31, ERG
📌 Remember: ROUND for round cell tumor discrimination - Rhabdomyosarcoma (MyoD+), Osteosarcoma (osteocalcin+), Undifferentiated sarcoma (negative panel), Neuroblastoma (synaptophysin+), Desmoplastic small round cell tumor (WT1+)
Grade discrimination in soft tissue sarcomas uses FNCLCC system with quantitative parameters:
- Differentiation: Score 1 (well-differentiated), Score 2 (moderately differentiated), Score 3 (poorly differentiated)
- Mitoses: Score 1 (<10 per 10 HPF), Score 2 (10-19 per 10 HPF), Score 3 (≥20 per 10 HPF)
- Necrosis: Score 0 (no necrosis), Score 1 (<50% necrosis), Score 2 (≥50% necrosis)
⭐ Clinical Pearl: Grade predicts outcome more accurately than histological subtype-Grade 1 sarcomas have <10% metastatic risk regardless of subtype, while Grade 3 sarcomas carry >50% metastatic potential with similar survival curves across different histologies
Metastatic versus primary discrimination in bone lesions requires systematic evaluation. Metastatic carcinoma shows cytokeratin positivity, multiple lesions (70%), and known primary tumor (60%). Primary bone sarcomas demonstrate single lesion (90%), young age (<30 years), and lineage-specific markers.
💡 Master This: Systematic discrimination requires integration of clinical, radiological, morphological, and molecular data-no single parameter provides definitive diagnosis, but algorithmic analysis achieves >95% diagnostic accuracy and guides appropriate therapeutic decisions
Prognostic discrimination incorporates multiple variables into predictive models. Nomograms for soft tissue sarcomas include age, size, grade, depth, and histological subtype to predict 5-year survival with 80% accuracy. Bone sarcoma staging combines grade, size, metastases, and compartmental involvement to determine treatment protocols and survival expectations.
Mastering differential discrimination transforms diagnostic uncertainty into systematic pattern recognition, enabling precise tumor classification that drives optimal therapeutic strategies and accurate prognostic counseling.
🔍 Differential Mastery: The Pathological Discrimination Engine


⚖️ Treatment Algorithms: The Therapeutic Decision Matrix
Risk stratification algorithms determine treatment intensity. Low-grade sarcomas (Grade 1) receive surgery alone with >90% local control and <10% metastatic risk. High-grade sarcomas (Grade 3) require multimodal therapy with neoadjuvant chemotherapy, wide surgical resection, and adjuvant treatment achieving 70-80% 5-year survival in localized disease.
Osteosarcoma treatment protocols follow standardized algorithms. Neoadjuvant chemotherapy using MAP protocol (Methotrexate, Adriamycin, Cisplatin) for 10-12 weeks achieves >90% necrosis in 60% of patients. Surgical resection with wide margins and limb salvage is possible in 85% of cases. Adjuvant chemotherapy continues for additional 20-30 weeks with protocol modifications based on histological response.
Ewing sarcoma algorithms emphasize systemic therapy due to micrometastatic disease in >90% of patients at diagnosis. VDC/IE protocol (Vincristine, Doxorubicin, Cyclophosphamide alternating with Ifosfamide, Etoposide) for 48-54 weeks achieves 70-80% event-free survival in localized disease. Local control combines surgery and/or radiation therapy based on anatomical location and resectability.
Soft tissue sarcoma treatment follows NCCN guidelines with size-based algorithms. Tumors <5 cm receive surgery alone if superficial and low-grade. Tumors >5 cm or deep location require multimodal therapy with neoadjuvant radiation (50 Gy) or adjuvant radiation (60-66 Gy) achieving >90% local control.
| Tumor Category | Surgery Approach | Radiation Therapy | Chemotherapy | 5-Year Survival | Local Control |
|---|---|---|---|---|---|
| Low-grade <5 cm | Wide excision | None | None | >95% | >95% |
| Low-grade >5 cm | Wide excision | 50-60 Gy | None | 85-90% | >90% |
| High-grade <5 cm | Wide excision | Consider RT | Consider chemo | 75-85% | 85-90% |
| High-grade >5 cm | Wide excision | 60-66 Gy | Anthracycline-based | 60-70% | >90% |
| Metastatic | Palliative | Palliative | Systemic therapy | 15-25% | Variable |
Chemotherapy selection follows histology-specific protocols. Anthracycline-based regimens (Doxorubicin + Ifosfamide) represent standard therapy for most sarcomas with response rates of 25-35%. Trabectedin shows activity in liposarcomas and leiomyosarcomas with progression-free survival improvement. Pazopanib demonstrates efficacy in non-adipocytic sarcomas with median PFS of 4.6 months.
📌 Remember: MAGIC for sarcoma chemotherapy selection - MAP for osteosarcoma, Anthracyclines for most sarcomas, Gemcitabine + docetaxel for uterine LMS, Ifosfamide for various types, Cyclophosphamide for rhabdomyosarcoma
Radiation therapy protocols optimize local control while minimizing toxicity. Intensity-modulated radiation therapy (IMRT) delivers precise dose distribution with 95% target coverage and <20% normal tissue exposure. Proton therapy reduces integral dose by 50-60% in pediatric patients, minimizing secondary malignancy risk.
Response assessment uses standardized criteria. RECIST 1.1 evaluates measurable disease with >30% size reduction defining partial response and >20% increase indicating progression. Pathological response in resected specimens correlates with survival outcomes->90% necrosis predicts improved event-free survival in osteosarcoma.
⭐ Clinical Pearl: Histological response to neoadjuvant chemotherapy represents the strongest prognostic factor in osteosarcoma-patients with >90% necrosis have 85% 5-year survival compared to 65% survival with <90% necrosis
Targeted therapy algorithms incorporate molecular profiling. GIST tumors with KIT mutations receive imatinib achieving >80% response rates. Dermatofibrosarcoma protuberans with PDGFB rearrangements responds to imatinib in >70% of cases. Alveolar soft part sarcoma shows activity with cediranib and other anti-angiogenic agents.
Surveillance protocols detect recurrence and metastases early. High-grade sarcomas require chest imaging every 3 months for 2 years, then every 6 months for 3 years. Local imaging occurs every 6 months for 5 years. Low-grade sarcomas follow less intensive schedules with annual imaging after initial 2-year period.
💡 Master This: Treatment algorithms must balance oncological outcomes with functional preservation-limb salvage is achievable in >85% of extremity sarcomas without compromising survival, while amputation may be necessary for optimal local control in complex anatomical locations
Multidisciplinary coordination optimizes treatment sequencing and outcome prediction. Sarcoma centers demonstrate improved survival compared to non-specialized facilities, with 5-year survival improvements of 10-15% through protocol adherence and specialized expertise.
Understanding treatment algorithms transforms complex therapeutic decisions into systematic, evidence-based protocols that maximize survival while preserving quality of life through coordinated multimodal care.
⚖️ Treatment Algorithms: The Therapeutic Decision Matrix

🔗 Integration Networks: The Pathophysiological Connectome
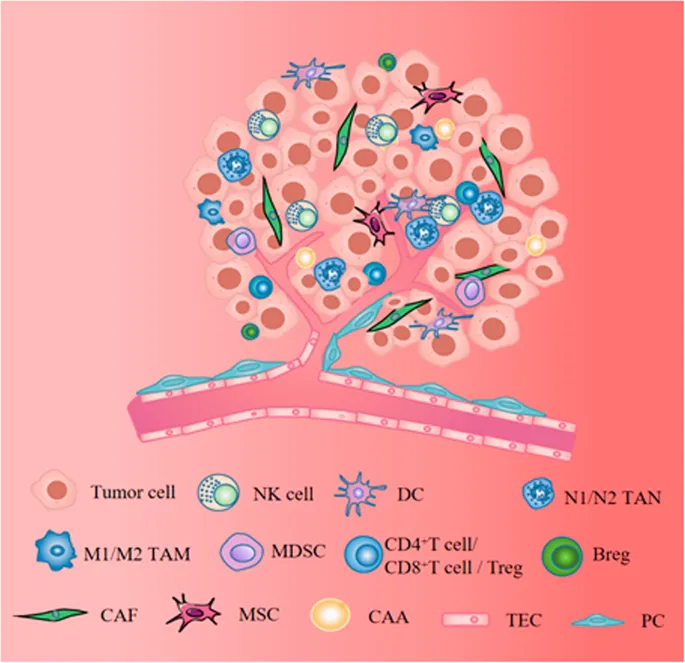
Tumor microenvironment integration creates complex cellular ecosystems. Sarcomas recruit tumor-associated macrophages (TAMs) comprising 30-50% of tumor mass, with M2-polarized phenotypes promoting angiogenesis and immune suppression. Cancer-associated fibroblasts (CAFs) produce growth factors and extracellular matrix components, creating desmoplastic reactions that facilitate tumor invasion and drug resistance.
Metabolic reprogramming in bone and soft tissue tumors follows Warburg effect principles. Osteosarcomas demonstrate 10-fold increased glucose uptake via GLUT1 overexpression, with lactate production rates of 50-100 nmol/mg protein/hour. PET-CT imaging exploits this metabolic signature, achieving >90% sensitivity for tumor detection and response assessment.
Bone remodeling integration reveals complex paracrine networks. Osteosarcomas disrupt normal RANK/RANKL/OPG signaling, leading to pathological bone formation and destruction. Metastatic carcinomas hijack "vicious cycle" mechanisms, where tumor-derived PTHrP stimulates osteoclast activation, releasing bone-derived growth factors that promote further tumor growth.
Immune system integration determines tumor surveillance and therapeutic response. Sarcomas demonstrate low mutational burden (median <5 mutations/Mb) compared to carcinomas (median >50 mutations/Mb), resulting in limited neoantigen presentation and poor immunotherapy response. Tumor-infiltrating lymphocytes (TILs) comprise <10% of tumor mass in most sarcomas, correlating with immune-cold phenotype.
Angiogenesis networks support tumor growth and metastatic dissemination. VEGF expression in high-grade sarcomas correlates with microvessel density (>20 vessels per HPF) and poor prognosis. Angiosarcomas demonstrate constitutive angiogenic signaling through MYC amplification or VEGFR mutations, creating highly vascular tumors with hemorrhagic tendency.
| Integration Network | Normal Function | Tumor Disruption | Clinical Manifestation | Therapeutic Target | Response Rate |
|---|---|---|---|---|---|
| Bone Remodeling | Balanced formation/resorption | Pathological bone changes | Pain, fractures | Bisphosphonates | 60-80% |
| Angiogenesis | Controlled vessel growth | Aberrant vascularization | Hemorrhage, metastases | Anti-VEGF agents | 20-30% |
| Immune Surveillance | Tumor recognition | Immune evasion | Progressive growth | Checkpoint inhibitors | 5-15% |
| Metabolic Pathways | Efficient energy use | Warburg effect | Cachexia, imaging changes | Metabolic modulators | Experimental |
| Matrix Homeostasis | Tissue integrity | Matrix degradation | Invasion, metastases | MMP inhibitors | Limited efficacy |
Endocrine integration involves multiple hormonal pathways. IGF-1 signaling promotes sarcoma growth through PI3K/AKT activation, with elevated IGF-1 levels correlating with poor prognosis in osteosarcoma. Estrogen receptor expression in certain sarcomas influences growth patterns and therapeutic sensitivity.
📌 Remember: SYSTEMS for sarcoma integration networks - Systemic metabolism (cachexia), Youth growth factors (IGF-1), Stromal interactions (CAFs), Tumor immunity (TILs), Endocrine effects (hormones), Matrix remodeling (MMPs), Signaling pathways (PI3K/AKT)
Therapeutic resistance integration involves multiple mechanisms. Multidrug resistance develops through P-glycoprotein overexpression in 40-60% of sarcomas, reducing intracellular drug accumulation. DNA repair pathway activation (PARP, ATM, BRCA) enables resistance to DNA-damaging agents. Hypoxia-inducible factor (HIF-1α) upregulation promotes survival under stress conditions.
Metastatic integration follows organ-specific patterns. Osteosarcoma metastasizes to lungs (85%) via hematogenous spread, with pulmonary microenvironment providing favorable growth conditions. Soft tissue sarcomas demonstrate size-dependent metastatic patterns-tumors >10 cm have >70% metastatic risk, while tumors <5 cm show <20% metastatic potential.
Circulating biomarker integration enables non-invasive monitoring. Circulating tumor DNA (ctDNA) detection correlates with tumor burden and treatment response in 60-80% of patients. Alkaline phosphatase and LDH elevation in osteosarcoma predict poor prognosis with >80% specificity. Circulating tumor cells (CTCs) provide real-time tumor biology assessment.
⭐ Clinical Pearl: Integration complexity explains therapeutic challenges in sarcomas-single-agent therapies achieve limited efficacy because multiple interconnected pathways maintain tumor survival, requiring combination strategies that target several networks simultaneously
Precision medicine integration incorporates molecular profiling into treatment algorithms. Comprehensive genomic profiling identifies actionable mutations in 30-40% of sarcomas, including PI3K/AKT pathway alterations (25%), cell cycle defects (20%), and DNA repair deficiencies (15%). Basket trials test mutation-specific therapies across multiple sarcoma subtypes.
💡 Master This: Systems integration reveals that sarcomas are complex ecosystems rather than isolated tumors-understanding network interactions enables rational combination therapies, biomarker development, and resistance prevention strategies that improve patient outcomes through precision medicine approaches
Future integration strategies focus on network-based therapeutics. Combination immunotherapy targeting multiple immune checkpoints shows promising early results. Metabolic modulators combined with standard chemotherapy may overcome resistance mechanisms. Liquid biopsy integration enables real-time treatment adaptation based on circulating biomarkers.
Understanding integration networks transforms sarcoma treatment from single-target approaches to systems-based strategies that address tumor complexity through coordinated multi-pathway interventions.
🔗 Integration Networks: The Pathophysiological Connectome

🎯 Clinical Mastery Arsenal: The Pathological Command Center
Essential diagnostic thresholds form the foundation arsenal. Age cutoffs provide immediate risk stratification-<30 years favors primary bone tumors, 30-50 years suggests soft tissue sarcomas, >50 years indicates metastatic disease (70% probability). Size thresholds determine malignancy risk-<5 cm carries <10% sarcoma risk, >5 cm increases risk to >50%, >10 cm approaches >80% malignancy probability.
Rapid assessment protocols enable immediate triage. "Red flag" indicators requiring urgent evaluation include night pain, rapid growth (doubling <6 months), size >5 cm, deep location, and age >50 years. Combination of ≥3 red flags mandates immediate imaging and specialist referral within 48-72 hours.
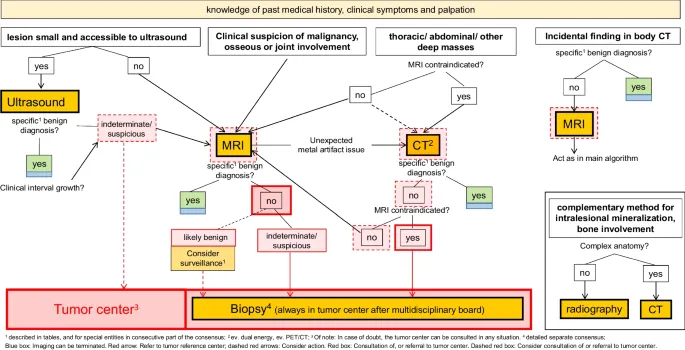
Master diagnostic algorithms integrate multiple data streams:
- Step 1: Age + Location → Initial differential (85% accuracy)
- Step 2: Imaging pattern → Refined differential (90% accuracy)
- Step 3: Biopsy + IHC → Definitive diagnosis (95% accuracy)
- Step 4: Molecular testing → Therapeutic targets (>98% accuracy)
📌 Remember: MASTER for sarcoma evaluation sequence - Mass identification, Age assessment, Size measurement, Tissue sampling, Expert consultation, Rapid treatment planning
Critical numbers arsenal for immediate reference:
| Clinical Parameter | Benign Threshold | Malignant Threshold | Action Required | Time Frame |
|---|---|---|---|---|
| Size | <5 cm | >5 cm | Imaging + biopsy | 1-2 weeks |
| Growth rate | Stable >2 years | Doubling <6 months | Urgent evaluation | 48-72 hours |
| Age (bone tumors) | Any age | 10-25 or >60 years | Specialist referral | 1 week |
| Mitotic count | <5 per 10 HPF | >10 per 10 HPF | Grade determination | Immediate |
| Necrosis percentage | <10% | >50% | High-grade designation | Immediate |
Biopsy technique optimization ensures diagnostic accuracy. Core needle biopsy achieves >90% diagnostic accuracy with 14-gauge needles and ≥3 samples. Biopsy tract placement must consider future surgical approaches-longitudinal orientation in extremities, direct approach to tumor, avoid neurovascular structures.
Treatment decision mastery follows evidence-based algorithms. Surgical margins determine local control-wide margins (>2 cm) achieve <5% recurrence, marginal margins result in 15-20% recurrence. Chemotherapy selection depends on histological subtype and grade-anthracycline-based for most sarcomas, MAP protocol for osteosarcoma, VDC/IE for Ewing sarcoma.
Prognostic assessment tools enable accurate counseling. Nomograms incorporate age, size, grade, depth, histology to predict 5-year survival with 80% accuracy. Staging systems (AJCC 8th edition) combine T-stage (size), N-stage (nodes), M-stage (metastases), G-stage (grade) for treatment planning.
⭐ Clinical Pearl: "Rule of halves" in sarcoma outcomes-localized high-grade sarcomas have ~50% cure rate, metastatic disease has ~25% 5-year survival, and local recurrence reduces survival by ~50% compared to primary treatment success
Surveillance mastery optimizes recurrence detection. High-grade sarcomas require chest CT every 3 months for 2 years (85% of metastases occur within this timeframe), then every 6 months for years 3-5. Local imaging occurs every 6 months for 5 years. Low-grade tumors follow less intensive protocols.
Complication management arsenal addresses treatment-related issues. Chemotherapy toxicity monitoring includes cardiac function (doxorubicin), renal function (cisplatin), hearing assessment (cisplatin), pulmonary function (bleomycin). Radiation toxicity manifests as acute skin reactions and late fibrosis, secondary malignancies (risk 1-2% at 10 years).
Emergency recognition protocols identify life-threatening complications. Tumor lysis syndrome in rapidly growing sarcomas requires immediate intervention. Pathological fractures in bone tumors need urgent orthopedic consultation. Compartment syndrome from tumor bleeding demands emergent fasciotomy.
Quality metrics mastery ensures optimal outcomes. Sarcoma centers demonstrate improved survival through protocol adherence, multidisciplinary care, and specialized expertise. Key performance indicators include time to diagnosis (<4 weeks), appropriate staging (>95%), adequate margins (>90%), protocol compliance (>85%).
💡 Master This: Clinical mastery combines systematic knowledge, pattern recognition, and decision-making algorithms into intuitive expertise-experienced clinicians integrate multiple data streams simultaneously, achieving rapid, accurate diagnoses and optimal treatment decisions that maximize patient outcomes while minimizing treatment-related morbidity
Continuous learning protocols maintain cutting-edge expertise. Molecular pathology advances require ongoing education in genomic testing, targeted therapies, and precision medicine. Clinical trial participation provides access to novel treatments and contributes to knowledge advancement. Multidisciplinary conferences ensure collaborative decision-making and knowledge sharing.
The clinical mastery arsenal transforms complex pathological knowledge into systematic, actionable expertise that enables rapid, accurate diagnosis and optimal therapeutic decision-making for improved patient outcomes.
🎯 Clinical Mastery Arsenal: The Pathological Command Center
Unlock the full lesson and continue reading
Signup to continue reading this lesson and unlimited access questions, flashcards, AI notes, and more


Have doubts about this lesson?
Ask Rezzy, your AI Study Mate, to explain anything you didn't understand
Everything you need for NEET-PG prep
Get full Oncourse access with lessons, practice questions, flashcards and AI study tools.
Scan to download app